action #41882
closedall arm worker die after some time
0%
Description
Machine dies after ~1 day. Seems like the kernel is stuck - no network available and SOL is just stuck (no agetty promt).
Files
| Screenshot_20200108_111458.png (74.6 KB) Screenshot_20200108_111458.png | |||
| log.xz (128 KB) log.xz |
Updated by coolo about 6 years ago
- Priority changed from Normal to Urgent
- Target version changed from Ready to Current Sprint
This host needs to be removed from the cluster (salt+dashboard) or being brought back
Updated by coolo about 6 years ago
- Project changed from openQA Project (public) to openQA Infrastructure (public)
- Category deleted (
168)
Updated by nicksinger about 6 years ago
- Status changed from New to In Progress
- Assignee set to nicksinger
Updated by nicksinger about 6 years ago
First issue why we can't see anything after grub: console needs to be changed to ttyAMA0
Updated by nicksinger about 6 years ago
- Status changed from In Progress to Resolved
Hm… don't really know what should be wrong with the machine. After changing the console to ttyAMA0 I was able to completely boot the machine and finish the "saltification".
It shows up in openQA as well as grafana again. Setting to feedback until the first jobs rolled by.
Updated by nicksinger about 6 years ago
- Subject changed from openqaworker-arm-3 seems dead to openqaworker-arm-3 dies after some time.
- Status changed from Resolved to Workable
Jup indeed, after one day of working properly It just self-destroyed again. eth0 not ping-able, sol activate stuck. BMC seems still to work fully.
Updated by nicksinger about 6 years ago
- Description updated (diff)
- Status changed from Workable to Blocked
Updated by nicksinger about 6 years ago
Updated by mkittler almost 6 years ago
- Subject changed from openqaworker-arm-3 dies after some time. to openqaworker-arm-3 and openqaworker-arm-1 die after some time
openqaworker-arm-1 is down again. I guess we need to extend this ticket to openqaworker-arm-1.
Updated by SLindoMansilla over 5 years ago
- Related to action #50123: [functional][u][aarch64] Can't open 'os-autoinst.pid' for writing: 'Structure needs cleaning' at /usr/bin/isotovideo line 300 added
Updated by SLindoMansilla over 5 years ago
- Related to action #50129: [functional][u] cannot remove directory for testresults: Directory not empty at /usr/lib/os-autoinst/bmwqemu.pm line 126 added
Updated by nicksinger over 5 years ago
- Subject changed from openqaworker-arm-3 and openqaworker-arm-1 die after some time to all arm worker die after some time
It affects all of our arm workers in the meantime.
I've enabled monitoring for them to instantly realize when they are down and will try to collect any logging at all.
Until now I failed with the approaches:
- Connect a monitor when the machine is "unresponsive" -> only prompt, no kernel log traces seen
- Connect a long running SOL session to catch kernel messages -> "ERROR" when looking for the machines once they crashed
My last idea is to enable the kernels netconsole to gather some logs at least.
Until now nobody was able to help us without any logs. We still didn't find a reliable reproducer besides "letting the machines run long enough with openQA workload" :(
Updated by okurz over 5 years ago
any update in the Engineering Infrastructure ticket?
Updated by okurz over 5 years ago
- Assignee changed from nicksinger to okurz
Actually I can access https://infra.nue.suse.com/SelfService/Display.html?id=123196 for some reason. It was resolved with "ask the ARM guys" so no need to wait further for the ticket. The symptoms look similar to what I am tracking already in #53471 so I guess you don't mind if I pick up this ticket as well and block by #53471
Updated by okurz over 5 years ago
- Related to action #56447: openqaworker-arm-2 is out-of-space on /was: openQA on osd fails with empty logs added
Updated by okurz over 5 years ago
- Status changed from Blocked to Feedback
https://gitlab.suse.de/openqa/salt-states-openqa/merge_requests/172 as workaround, https://gitlab.suse.de/openqa/salt-states-openqa/merge_requests/173 for debugging. nsinger is also working on an alternative to https://gitlab.suse.de/openqa/salt-states-openqa/merge_requests/172 to detect the workers dying from grafana and triggering a reboot from there.
EDIT: The automatic detection of workers being down is done as in https://stats.openqa-monitor.qa.suse.de/d/1bNU0StZz/automatic-actions?tab=alert&orgId=1&fullscreen&edit&panelId=3 and the power cycling is triggered in https://gitlab.suse.de/nicksinger/grafana-webhook-actions/-/jobs . As this works ok-ish over the past days nsinger planned to move to "openqa/…" project scope. Suggestion for improvement are in https://gitlab.suse.de/nicksinger/grafana-webhook-actions/merge_requests/1
Today in the morning of 2019-09-27 arm3 is still inoperable from yesterday as services failed to start. For this I plan as workaround to apply proper systemd based "restart" policies. Then arm2 went down and was not restarted, I triggered the power cycle manually. Then arm1 went down. I wonder if too high load causes this. Because the other two machines arm2 and arm3 were basically unusable, arm1 might have been hit by higher workload. https://stats.openqa-monitor.qa.suse.de/d/WDopenqaworker-arm-1/worker-dashoard-openqaworker-arm-1?orgId=1&from=1569565893750&to=1569566741861&fullscreen&panelId=54694 shows that the load increased before the host went down. https://stats.openqa-monitor.qa.suse.de/d/WDopenqaworker-arm-2/worker-dashoard-openqaworker-arm-2?orgId=1&from=1569561977310&to=1569565306365&fullscreen&panelId=54694 shows the same for arm2, but it does not seem to be "I/O wait" which would point to problems with the storage.
EDIT: 2019-10-01: nsinger moved gitlab repo to https://gitlab.suse.de/openqa/grafana-webhook-actions now
EDIT: 2019-10-02: Found on openqaworker-arm-1 during bootup:
[ SKIP ] Ordering cycle found, skipping Update is Completed
[ SKIP ] Ordering cycle found, skipping Rebuild Journal Catalog
[ SKIP ] Ordering cycle found, skipping Watch for changes in CA certificates
[ SKIP ] Ordering cycle found, skipping Tell Plymouth To Write Out Runtime Data
[ SKIP ] Ordering cycle found, skipping Update UTMP about System Boot/Shutdown
[ SKIP ] Ordering cycle found, skipping Security Auditing Service
[ SKIP ] Ordering cycle found, skipping Local File Systems
I suspect the side-/upgrade to have caused this. Probably I can cleanup some unused packages and services first before trying to find cycles, e.g. salt '*arm*' cmd.run 'zypper --no-refresh -n rm -u cups cups-client cups-config cups-filters libcups2 libcupscgi1 libcupsimage2 libcupsmime1 libcupsppdc1'
Rebooted arm1 and:
[ SKIP ] Ordering cycle found, skipping D-Bus System Message Bus Socket
[ SKIP ] Ordering cycle found, skipping Security Auditing Service
[ SKIP ] Ordering cycle found, skipping Tell Plymouth To Write Out Runtime Data
[ SKIP ] Ordering cycle found, skipping Local File Systems
oh, and [FAILED] Failed to start wicked managed network interfaces. so network busted ;D
another reboot and the only problem I see is
[ SKIP ] Ordering cycle found, skipping /var/lib/openqa/nvme/pool
and network is fine. The above is troubling though. I checked, the directory is actually not mounted. Fixed temporarily with mount -a.
journalctl -b shows:
Oct 04 18:28:19 openqaworker-arm-1 systemd[1]: local-fs.target: Found ordering cycle on local-fs.target/start
Oct 04 18:28:19 openqaworker-arm-1 systemd[1]: local-fs.target: Found dependency on var-lib-openqa-nvme-pool.mount/start
Oct 04 18:28:19 openqaworker-arm-1 systemd[1]: local-fs.target: Found dependency on var-lib-openqa-nvme.mount/start
Oct 04 18:28:19 openqaworker-arm-1 systemd[1]: local-fs.target: Found dependency on openqa_nvme_format.service/start
Oct 04 18:28:19 openqaworker-arm-1 systemd[1]: local-fs.target: Found dependency on basic.target/start
Oct 04 18:28:19 openqaworker-arm-1 systemd[1]: local-fs.target: Found dependency on paths.target/start
Oct 04 18:28:19 openqaworker-arm-1 systemd[1]: local-fs.target: Found dependency on btrfsmaintenance-refresh.path/start
Oct 04 18:28:19 openqaworker-arm-1 systemd[1]: local-fs.target: Found dependency on sysinit.target/start
Oct 04 18:28:19 openqaworker-arm-1 systemd[1]: local-fs.target: Found dependency on local-fs.target/start
Oct 04 18:28:19 openqaworker-arm-1 systemd[1]: local-fs.target: Breaking ordering cycle by deleting job var-lib-openqa-nvme-pool.mount/start
Oct 04 18:28:19 openqaworker-arm-1 systemd[1]: var-lib-openqa-nvme-pool.mount: Job var-lib-openqa-nvme-pool.mount/start deleted to break ordering cycle starting with local-fs.target/start
maybe https://unix.stackexchange.com/questions/193714/generic-methodology-to-debug-ordering-cycles-in-systemd can help.
I checked on which machines we have cycles with
salt '*' cmd.run 'journalctl | grep "ordering cycle"'
and I found them on all arm1…3 but only there so I rather suspect the nvme prepare service rather than the SLE-to-Leap sidegrade being the culprit.
On arm3:
sudo systemctl mask --now salt-minion openqa-worker.target
sudo vim /etc/systemd/system/openqa_nvme_format.service
added DefaultDependencies=no as per https://bugzilla.suse.com/show_bug.cgi?id=1149603#c10 and sudo sync && sudo systemctl kexec. Still a cycle, added DefaultDependencies=no to /etc/systemd/system/var-lib-openqa-cache.mount.d/override.conf and trying again. Also needed to add the line to /etc/systemd/system/openqa_nvme_prepare.service and /etc/systemd/system/var-lib-openqa-pool.mount.d/override.conf , rebooted and sudo journalctl -b | grep -i '\(ordering cycle\|Found dependency\)' does not report any new.
Fixed in https://gitlab.suse.de/openqa/salt-states-openqa/merge_requests/192
Updated by okurz about 5 years ago
- Priority changed from Urgent to High
as we have the automatic restart actions in https://gitlab.suse.de/openqa/grafana-webhook-actions now the prio is not "Urgent" anymore but still "High" as even on automatic restarts services within the machines can fail to start up.
Updated by okurz about 5 years ago
- Status changed from Feedback to Resolved
with the ordering cycles fixed, all three arm workers up and automatically rebooted based on grafana alerts and gitlab CI actions I consider this done.
Updated by okurz about 5 years ago
- Status changed from Resolved to Feedback
I have another idea. https://gitlab.suse.de/openqa/salt-pillars-openqa/merge_requests/201 created, monitoring.
Updated by okurz about 5 years ago
according to slindomansilla the reduce of workers is not applied automatically, he did that manually after salt was applied. I thought we had that handled automatically. https://stats.openqa-monitor.qa.suse.de/d/1bNU0StZz/automatic-actions?orgId=1&from=now-30d&to=now shows that arm-2 is still very unstable but it could be that arm-1 improved, too early to say. I tried out "sensors" on arm-2 but the machine does not provide any sensors that are readable by the OS. I am now running while sleep 30; do (date -Is; ipmitool -I lanplus -H openqaworker-arm-2-ipmi.suse.de -U on lord.arch saving to /local/. The next time the machine dies we can compare values and see if there are e.g. voltage drops or temperature problems.
ADMIN -P ADMIN sensor) | tee -a arm-2_sensors-$(date -I).log; done
EDIT: 2019-12-11: Again the machine died as visible in https://stats.openqa-monitor.qa.suse.de/d/1bNU0StZz/automatic-actions?orgId=1&from=1576072244796&to=1576081908796&fullscreen&panelId=3 . What I can see in the sensor output recorded as described above:
idle time in the morning:
2019-12-11T06:43:25+01:00
CPU0_TEMP        | 38.000     | degrees C  | ok    | na        | 0.000     | 5.000     | 85.000    | 88.000    | na
CPU1_TEMP        | 42.000     | degrees C  | ok    | na        | 0.000     | 5.000     | 85.000    | 88.000    | na
VR_P0_IOUT       | 54.000     | Amps       | ok    | na        | na        | na        | 228.000   | 248.000   | na
VR_P1_IOUT       | 58.000     | Amps       | ok    | na        | na        | na        | 228.000   | 248.000   | na
BPB_FAN_1A       | 7400.000   | RPM        | ok    | na        | 800.000   | 1000.000  | na        | na        | na
BPB_FAN_2A       | 7300.000   | RPM        | ok    | na        | 800.000   | 1000.000  | na        | na        | na
BPB_FAN_3A       | 7400.000   | RPM        | ok    | na        | 800.000   | 1000.000  | na        | na        | na
BPB_FAN_4A       | 7500.000   | RPM        | ok    | na        | 800.000   | 1000.000  | na        | na        | na
MB_TEMP1         | 31.000     | degrees C  | ok    | na        | 0.000     | 5.000     | 75.000    | 80.000    | na
2019-12-11T15:12:13+01:00
CPU0_TEMP        | 41.000     | degrees C  | ok    | na        | 0.000     | 5.000     | 85.000    | 88.000    | na
CPU1_TEMP        | 45.000     | degrees C  | ok    | na        | 0.000     | 5.000     | 85.000    | 88.000    | na
VR_P0_IOUT       | 67.000     | Amps       | ok    | na        | na        | na        | 228.000   | 248.000   | na
VR_P1_IOUT       | 71.000     | Amps       | ok    | na        | na        | na        | 228.000   | 248.000   | na
BPB_FAN_1A       | 7400.000   | RPM        | ok    | na        | 800.000   | 1000.000  | na        | na        | na
BPB_FAN_2A       | 7300.000   | RPM        | ok    | na        | 800.000   | 1000.000  | na        | na        | na
BPB_FAN_3A       | 7400.000   | RPM        | ok    | na        | 800.000   | 1000.000  | na        | na        | na
BPB_FAN_4A       | 7500.000   | RPM        | ok    | na        | 800.000   | 1000.000  | na        | na        | na
MB_TEMP1         | 32.000     | degrees C  | ok    | na        | 0.000     | 5.000     | 75.000    | 80.000    | na
so clearly CPU temp and drawn electrical power increased at a time when the worker was receiving higher load, doesn't mean that the machine can not handle this though. However I will try to reduce the workers further. Did sudo systemctl mask --now openqa-worker@{5..20} on arm-2. Let's see if we crash again.
EDIT: 2019-12-11: the management interface of openqaworker-arm-3 appeared again. I powered the machine off, waited, powered on, waited 10m and I could ssh. Also the SOL showed a login prompt after disconnecting/connecting again. although no information during bootup. I updated the machine, accepted the salt key on osd and applied high state. Should be good to go again. Actually I think besides the major one-month outage the machine was ok and not that problem as arm-1 and arm-2, see https://stats.openqa-monitor.qa.suse.de/d/1bNU0StZz/automatic-actions?from=now-90d&to=now . Updated pillar data again to use the full numbers of worker on arm-3. So currently we have 20 on arm-1, 4 on arm-2, 30 on arm-3.
Updated by okurz almost 5 years ago
So currently realized that arm-1 fails to respond to a salt call in https://gitlab.suse.de/openqa/osd-deployment/-/jobs/156074 . I could login to the machine though and see the high load:
# cat /proc/loadavg
302.47 302.64 302.70 6/1675 40425
dmesg output:
Jan 08 06:18:02 openqaworker-arm-1 kernel: BUG: workqueue lockup - pool cpus=26 node=0 flags=0x0 nice=0 stuck for 11857s!
Jan 08 06:18:02 openqaworker-arm-1 kernel: Showing busy workqueues and worker pools:
Jan 08 06:18:02 openqaworker-arm-1 kernel: workqueue mm_percpu_wq: flags=0x8
Jan 08 06:18:02 openqaworker-arm-1 kernel:   pwq 52: cpus=26 node=0 flags=0x0 nice=0 active=1/256
Jan 08 06:18:02 openqaworker-arm-1 kernel:     pending: lru_add_drain_per_cpu BAR(39133)
Jan 08 06:18:02 openqaworker-arm-1 kernel: workqueue writeback: flags=0x4e
Jan 08 06:18:02 openqaworker-arm-1 kernel:   pwq 96: cpus=0-47 flags=0x4 nice=0 active=1/256
Jan 08 06:18:02 openqaworker-arm-1 kernel:     in-flight: 5593:wb_workfn
Jan 08 06:18:02 openqaworker-arm-1 kernel: workqueue kblockd: flags=0x18
Jan 08 06:18:02 openqaworker-arm-1 kernel:   pwq 17: cpus=8 node=0 flags=0x0 nice=-20 active=1/256
Jan 08 06:18:02 openqaworker-arm-1 kernel:     in-flight: 0:blk_mq_timeout_work
Jan 08 06:18:02 openqaworker-arm-1 kernel:   pwq 7: cpus=3 node=0 flags=0x0 nice=-20 active=2/256
Jan 08 06:18:02 openqaworker-arm-1 kernel:     in-flight: 20871:blk_mq_timeout_work blk_mq_timeout_work
Jan 08 06:18:02 openqaworker-arm-1 kernel: pool 7: cpus=3 node=0 flags=0x0 nice=-20 hung=11816s workers=3 idle: 20907 30
Jan 08 06:18:02 openqaworker-arm-1 kernel: pool 17: cpus=8 node=0 flags=0x0 nice=-20 hung=12965s workers=3 idle: 29568 60
Jan 08 06:18:02 openqaworker-arm-1 kernel: pool 96: cpus=0-47 flags=0x4 nice=0 hung=0s workers=6 idle: 40179 40011 40204 40261
Jan 08 06:18:06 openqaworker-arm-1 kernel: INFO: rcu_sched detected stalls on CPUs/tasks:
Jan 08 06:18:06 openqaworker-arm-1 kernel:         26-...: (1 GPs behind) idle=23e/140000000000000/0 softirq=443547/443548 fqs=1125189
Jan 08 06:18:06 openqaworker-arm-1 kernel:         (detected by 25, t=2670743 jiffies, g=270909, c=270908, q=14756827)
Jan 08 06:18:06 openqaworker-arm-1 kernel: Task dump for CPU 26:
Jan 08 06:18:06 openqaworker-arm-1 kernel: lspci           R  running task        0 30539   7214 0x00000002
Jan 08 06:18:06 openqaworker-arm-1 kernel: Call trace:
Jan 08 06:18:06 openqaworker-arm-1 kernel:  ret_from_fork+0x0/0x20
lines 944-1001/1001 (END)
Message from syslogd@openqaworker-arm-1 at Jan  8 06:18:33 ...
 kernel:[44878.886279] BUG: workqueue lockup - pool cpus=26 node=0 flags=0x0 nice=0 stuck for 11888s!
on arm-1 .
There seem to be many processes stuck on I/O and many zombies:
$ tail -n 40 ps_auxf_arm_1-2020-01-08
_openqa+ 48094  100  0.2 2035544 617788 ?      Sl   Jan07 588:50          \_ /usr/bin/qemu-system-aarch64 -device virtio-gpu-pci -chardev ringbuf,id=serial0,logfile=serial0,logappend=on -serial chardev:serial0 -soundhw hda -m 1024 -machine virt,usb=off,gic-version=3,its=off -cpu host -netdev tap,id=qanet0,ifname=tap13,script=no,downscript=no -device virtio-net,netdev=qanet0,mac=52:54:00:12:01:e7 -device nec-usb-xhci -device usb-tablet -device usb-kbd -smp 2 -enable-kvm -no-shutdown -vnc :104,share=force-shared -device virtio-serial -chardev pipe,id=virtio_console,path=virtio_console,logfile=virtio_console.log,logappend=on -device virtconsole,chardev=virtio_console,name=org.openqa.console.virtio_console -chardev socket,path=qmp_socket,server,nowait,id=qmp_socket,logfile=qmp_socket.log,logappend=on -qmp chardev:qmp_socket -S -device virtio-scsi-pci,id=scsi0 -blockdev driver=file,node-name=hd0-overlay0-file,filename=/var/lib/openqa/nvme/pool/14/raid/hd0-overlay0,cache.no-flush=on -blockdev driver=qcow2,node-name=hd0-overlay0,file=hd0-overlay0-file,cache.no-flush=on -device virtio-blk-device,id=hd0-device,drive=hd0-overlay0,bootindex=0,serial=hd0 -blockdev driver=file,node-name=cd0-overlay0-file,filename=/var/lib/openqa/nvme/pool/14/raid/cd0-overlay0,cache.no-flush=on -blockdev driver=qcow2,node-name=cd0-overlay0,file=cd0-overlay0-file,cache.no-flush=on -device scsi-cd,id=cd0-device,drive=cd0-overlay0,serial=cd0 -drive id=pflash-code-overlay0,if=pflash,file=/var/lib/openqa/nvme/pool/14/raid/pflash-code-overlay0,unit=0,readonly=on -drive id=pflash-vars-overlay0,if=pflash,file=/var/lib/openqa/nvme/pool/14/raid/pflash-vars-overlay0,unit=1
_openqa+ 15572  0.0  0.0  77520 71360 ?        Ds   Jan07   0:23 /usr/bin/perl /usr/share/openqa/script/worker --instance 15
_openqa+ 41949  0.1  0.0 231784 222240 ?       S    Jan07   0:59  \_ perl /usr/bin/isotovideo -d
_openqa+ 41954  0.0  0.0  70744 53040 ?        S    Jan07   0:04      \_ /usr/bin/isotovideo: comman
_openqa+ 41976  0.1  0.0 1019964 183980 ?      D    Jan07   0:47      \_ /usr/bin/isotovideo: autote
_openqa+ 41977  5.9  0.1 4562084 457236 ?      Dl   Jan07  36:13      \_ /usr/bin/isotovideo: backen
_openqa+ 41978  1.2  0.0 882628 56736 ?        SN   Jan07   7:19          \_ /usr/lib/os-autoinst/videoencoder /var/lib/openqa/nvme/pool/15/video.ogv
_openqa+ 42013 15.5  0.5 6437164 1516604 ?     Sl   Jan07  94:16          \_ /usr/bin/qemu-system-aarch64 -device virtio-gpu-pci -only-migratable -chardev ringbuf,id=serial0,logfile=serial0,logappend=on -serial chardev:serial0 -soundhw hda -m 1024 -machine virt,usb=off,gic-version=3,its=off -cpu host -netdev user,id=qanet0 -device virtio-net,netdev=qanet0,mac=52:54:00:12:34:56 -device nec-usb-xhci -device usb-tablet -device usb-kbd -smp 2 -enable-kvm -no-shutdown -vnc :105,share=force-shared -device virtio-serial -chardev pipe,id=virtio_console,path=virtio_console,logfile=virtio_console.log,logappend=on -device virtconsole,chardev=virtio_console,name=org.openqa.console.virtio_console -chardev socket,path=qmp_socket,server,nowait,id=qmp_socket,logfile=qmp_socket.log,logappend=on -qmp chardev:qmp_socket -S -device virtio-scsi-pci,id=scsi0 -blockdev driver=file,node-name=hd0-overlay0-file,filename=/var/lib/openqa/nvme/pool/15/raid/hd0-overlay0,cache.no-flush=on -blockdev driver=qcow2,node-name=hd0-overlay0,file=hd0-overlay0-file,cache.no-flush=on -device virtio-blk-device,id=hd0-device,drive=hd0-overlay0,serial=hd0 -blockdev driver=file,node-name=cd0-overlay0-file,filename=/var/lib/openqa/nvme/pool/15/raid/cd0-overlay0,cache.no-flush=on -blockdev driver=qcow2,node-name=cd0-overlay0,file=cd0-overlay0-file,cache.no-flush=on -device scsi-cd,id=cd0-device,drive=cd0-overlay0,bootindex=0,serial=cd0 -drive id=pflash-code-overlay0,if=pflash,file=/var/lib/openqa/nvme/pool/15/raid/pflash-code-overlay0,unit=0,readonly=on -drive id=pflash-vars-overlay0,if=pflash,file=/var/lib/openqa/nvme/pool/15/raid/pflash-vars-overlay0,unit=1
_openqa+ 15583  0.0  0.0  96684 90544 ?        Ds   Jan07   0:28 /usr/bin/perl /usr/share/openqa/script/worker --instance 16
_openqa+ 13518  0.0  0.0 155152 141984 ?       S    Jan07   0:14  \_ perl /usr/bin/isotovideo -d
_openqa+ 13526  0.0  0.0  70496 52724 ?        S    Jan07   0:03      \_ /usr/bin/isotovideo: comman
_openqa+ 13594  0.0  0.0 960300 135768 ?       S    Jan07   0:05      \_ /usr/bin/isotovideo: autote
_openqa+ 13597  0.5  0.2 4870016 765108 ?      Dl   Jan07   3:16      \_ /usr/bin/isotovideo: backen
_openqa+ 13598  0.8  0.0 882776 56192 ?        DN   Jan07   4:31          \_ /usr/lib/os-autoinst/videoencoder /var/lib/openqa/nvme/pool/16/video.ogv
_openqa+ 13632  3.1  0.5 6236572 1397708 ?     Sl   Jan07  17:09          \_ /usr/bin/qemu-system-aarch64 -device virtio-gpu-pci -only-migratable -chardev ringbuf,id=serial0,logfile=serial0,logappend=on -serial chardev:serial0 -soundhw hda -m 1024 -machine virt,usb=off,gic-version=3,its=off -cpu host -netdev user,id=qanet0 -device virtio-net,netdev=qanet0,mac=52:54:00:12:34:56 -device nec-usb-xhci -device usb-tablet -device usb-kbd -smp 2 -enable-kvm -no-shutdown -vnc :106,share=force-shared -device virtio-serial -chardev pipe,id=virtio_console,path=virtio_console,logfile=virtio_console.log,logappend=on -device virtconsole,chardev=virtio_console,name=org.openqa.console.virtio_console -chardev socket,path=qmp_socket,server,nowait,id=qmp_socket,logfile=qmp_socket.log,logappend=on -qmp chardev:qmp_socket -S -device virtio-scsi-pci,id=scsi0 -blockdev driver=file,node-name=hd0-overlay0-file,filename=/var/lib/openqa/nvme/pool/16/raid/hd0-overlay0,cache.no-flush=on -blockdev driver=qcow2,node-name=hd0-overlay0,file=hd0-overlay0-file,cache.no-flush=on -device virtio-blk-device,id=hd0-device,drive=hd0-overlay0,bootindex=0,serial=hd0 -blockdev driver=file,node-name=cd0-overlay0-file,filename=/var/lib/openqa/nvme/pool/16/raid/cd0-overlay0,cache.no-flush=on -blockdev driver=qcow2,node-name=cd0-overlay0,file=cd0-overlay0-file,cache.no-flush=on -device scsi-cd,id=cd0-device,drive=cd0-overlay0,serial=cd0 -drive id=pflash-code-overlay0,if=pflash,file=/var/lib/openqa/nvme/pool/16/raid/pflash-code-overlay0,unit=0,readonly=on -drive id=pflash-vars-overlay0,if=pflash,file=/var/lib/openqa/nvme/pool/16/raid/pflash-vars-overlay0,unit=1
_openqa+ 15596  0.0  0.0  71604 65808 ?        Ss   Jan07   0:24 /usr/bin/perl /usr/share/openqa/script/worker --instance 17
_openqa+ 29067  0.0  0.0 182208 170704 ?       D    Jan07   0:16  \_ perl /usr/bin/isotovideo -d
_openqa+ 29078  0.0  0.0      0     0 ?        Z    Jan07   0:01      \_ [/usr/bin/isotov] <defunct>
_openqa+ 29103  0.0  0.0 976780 150636 ?       D    Jan07   0:15      \_ /usr/bin/isotovideo: autote
_openqa+ 29105  1.2  0.1 4467172 370808 ?      Dl   Jan07   7:57      \_ /usr/bin/isotovideo: backen
_openqa+ 29106  1.7  0.0      0     0 ?        ZN   Jan07  11:18          \_ [videoencoder] <defunct>
_openqa+ 29165  0.5  0.0      0     0 ?        Zl   Jan07   3:37          \_ [qemu-system-aar] <defunct>
_openqa+ 15607  0.0  0.0 116076 110412 ?       Ds   Jan07   0:34 /usr/bin/perl /usr/share/openqa/script/worker --instance 18
_openqa+ 19435  0.0  0.0 155976 142204 ?       S    Jan07   0:09  \_ perl /usr/bin/isotovideo -d
_openqa+ 19441  0.0  0.0  70096 52344 ?        S    Jan07   0:03      \_ /usr/bin/isotovideo: comman
_openqa+ 19473  0.0  0.0 964156 136768 ?       S    Jan07   0:01      \_ /usr/bin/isotovideo: autote
_openqa+ 19475  0.3  0.3 4902720 800988 ?      Dl   Jan07   2:04      \_ /usr/bin/isotovideo: backen
_openqa+ 19476  0.0  0.0 882452 57476 ?        DN   Jan07   0:29          \_ /usr/lib/os-autoinst/videoencoder /var/lib/openqa/nvme/pool/18/video.ogv
_openqa+ 19513  1.5  0.4 2260116 1072312 ?     Sl   Jan07   8:17          \_ /usr/bin/qemu-system-aarch64 -device virtio-gpu-pci -only-migratable -chardev ringbuf,id=serial0,logfile=serial0,logappend=on -serial chardev:serial0 -soundhw hda -m 1024 -machine virt,usb=off,gic-version=3,its=off -cpu host -netdev user,id=qanet0 -device virtio-net,netdev=qanet0,mac=52:54:00:12:34:56 -device nec-usb-xhci -device usb-tablet -device usb-kbd -smp 2 -enable-kvm -no-shutdown -vnc :108,share=force-shared -chardev socket,path=qmp_socket,server,nowait,id=qmp_socket,logfile=qmp_socket.log,logappend=on -qmp chardev:qmp_socket -S -device virtio-scsi-pci,id=scsi0 -blockdev driver=file,node-name=hd0-overlay0-file,filename=/var/lib/openqa/nvme/pool/18/raid/hd0-overlay0,cache.no-flush=on -blockdev driver=qcow2,node-name=hd0-overlay0,file=hd0-overlay0-file,cache.no-flush=on -device virtio-blk-device,id=hd0-device,drive=hd0-overlay0,bootindex=0,serial=hd0 -blockdev driver=file,node-name=cd0-overlay0-file,filename=/var/lib/openqa/nvme/pool/18/raid/cd0-overlay0,cache.no-flush=on -blockdev driver=qcow2,node-name=cd0-overlay0,file=cd0-overlay0-file,cache.no-flush=on -device scsi-cd,id=cd0-device,drive=cd0-overlay0,serial=cd0 -drive id=pflash-code-overlay0,if=pflash,file=/var/lib/openqa/nvme/pool/18/raid/pflash-code-overlay0,unit=0,readonly=on -drive id=pflash-vars-overlay0,if=pflash,file=/var/lib/openqa/nvme/pool/18/raid/pflash-vars-overlay0,unit=1
_openqa+ 15620  0.0  0.0  72524 66696 ?        Ss   Jan07   0:19 /usr/bin/perl /usr/share/openqa/script/worker --instance 19
_openqa+ 29657  0.5  0.0      0     0 ?        Zl   Jan07   3:29  \_ [qemu-system-aar] <defunct>
root     15683  0.9  0.0 6326216 139284 ?      Ssl  Jan07   6:15 /usr/bin/telegraf -config /etc/telegraf/telegraf.conf -config-directory /etc/telegraf/telegraf.d
root     21512  0.0  0.0 163252  5272 ?        DNs  Jan07   0:00 (coredump)
root     23247  0.0  0.0 163252  5272 ?        DNs  Jan07   0:00 (coredump)
root     23249  0.0  0.0 163252  5272 ?        DNs  Jan07   0:00 (coredump)
root     30466  0.0  0.0 1006652 62748 ?       Dl   Jan07   0:04 /usr/bin/python3 /usr/bin/salt-minion
root     39124  0.0  0.0  36416 20016 ?        Ss   03:00   0:00 /usr/bin/zypper -n patch --replacefiles --auto-agree-with-licenses --force-resolution --download-in-advance
root     39133  0.0  0.0   8424  1380 ?        D    03:00   0:00 /usr/bin/gpg2 --version
okurz    40270  0.2  0.0  14388  7148 ?        Ss   06:16   0:00 /usr/lib/systemd/systemd --user
okurz    40271  0.0  0.0 168576  3088 ?        S    06:16   0:00  \_ (sd-pam)
after three more hours the system does not react on ping anymore, ssh does not work but SOL is still active albeit slow to login. Seems many processes are stuck in IO wait, https://stats.openqa-monitor.qa.suse.de/d/WDopenqaworker-arm-1/worker-dashoard-openqaworker-arm-1?orgId=1&refresh=1m&from=now-24h&to=now reflects this as well. https://stats.openqa-monitor.qa.suse.de/d/WDopenqaworker-arm-1/worker-dashoard-openqaworker-arm-1?orgId=1&from=1578402000000&to=1578474000000
dd bs=1M if=/dev/urandom of=test.img count=10240
gets blocked near immediate.
root     41857  0.0  0.0   3452  2320 pts/2    D+   09:41   0:00              |   \_ dd bs=1M if=/dev/urandom of=test.img count=10240
root     41884  0.0  0.0   3096   488 pts/3    S+   09:41   0:00                  \_ grep --color=auto dd
and
openqaworker-arm-1:~ # cat /proc/41857/stack
[<ffff000008087f14>] __switch_to+0xe4/0x150
[<ffff00000810ff08>] io_schedule+0x20/0x40
[<ffff00000823b0f0>] __lock_page+0xf0/0x120
[<ffff00000823c610>] pagecache_get_page+0x1d0/0x270
[<ffff0000083a66c0>] ext4_mb_init_group+0x90/0x278
[<ffff0000083a6a60>] ext4_mb_good_group+0x1b8/0x1c8
[<ffff0000083aa1d4>] ext4_mb_regular_allocator+0x18c/0x4c0
[<ffff0000083ac528>] ext4_mb_ne/0x50
[<ffff000008395e98>] ext4_block_write_begin+0x138/0x490
[<ffff00000839e430>] ext4_write_begin+0x160/0x550
[<ffff00000823bf08>] generic_perform_write+0x98/0x188
[<ffff00000823d9d0>] __generic_file_write_iter+0x158/0x1c8
[<ffff00000838a41c>] ext4_file_write_iter+0xa4/0x388
[<ffff0000082d7ff8>] __vfs_write+0xd0/0x148
[<ffff0000082d9774>] vfs_write+0xac/0x1b8
[<ffff0000082dae3c>] SyS_write+0x54/0xb0
[<ffff000008083d30>] el0_svc_naked+0x44/0x48
[<ffffffffffffffff>] 0xffffffffffffffff
checking the NVME state turned out "live", e.g. with cat /sys/class/nvme/nvme0/state. We tried to reset it causing:
cat /sys/class/nvme/nvme0/state
resetting
but not completing.
Updated by okurz almost 5 years ago
screenshot of grafana dashboard showing the maxed load and IO wait:
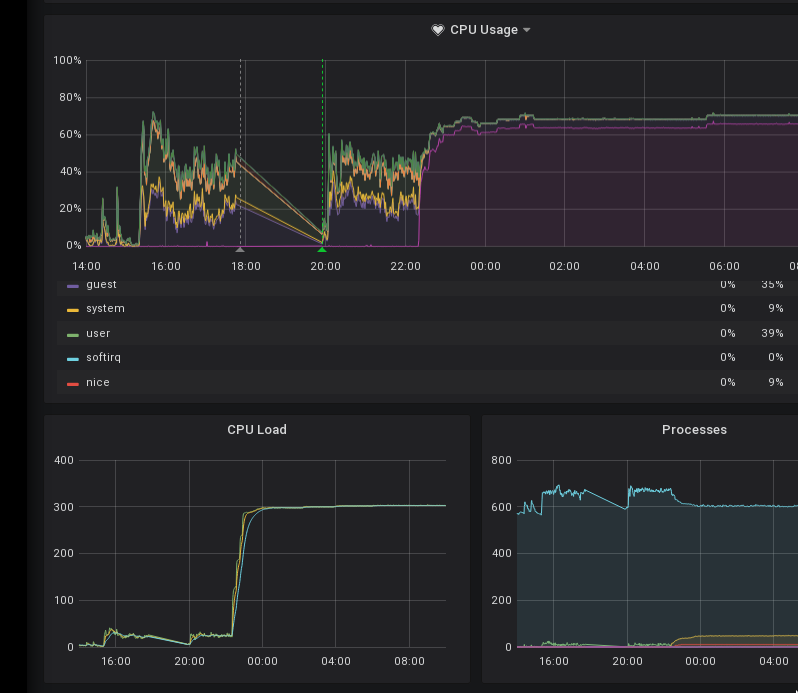
I am not yet sure if this is a reproducible problem or the real issue we are looking for.
Updated by okurz almost 5 years ago
okurz wrote:
Updated pillar data again to use the full numbers of worker on arm-3. So currently we have 20 on arm-1, 4 on arm-2, 30 on arm-3.
https://stats.openqa-monitor.qa.suse.de/d/1bNU0StZz/automatic-actions?from=1577833200000&to=1578610799000 shows 3 reboots for arm-1 and arm-3 but only 1 for arm-2 with the reduced set of worker instances. Could be that reduced number of worker instances help. But salt state apply fails as in https://gitlab.suse.de/openqa/salt-states-openqa/-/jobs/156742 because of the masked workers. We should use salt pillar data instead of masked workers. So unmasked and enabled openQA worker instance {5..30} on arm-2 again.
https://gitlab.suse.de/openqa/salt-pillars-openqa/merge_requests/206 created and merged to bump arm-2 again to 30 but arm-3 down to 4 to crosscheck.
Updated by okurz almost 5 years ago
added a comment on https://trello.com/c/JQtnALhz/6-openqa-hw-budget-planning#comment-5e185a3e9a5c3786c32fd089 for a kind request for budget for new hardware.
Updated by okurz almost 5 years ago
- Related to action #25864: [tools][functional][u] stall detected in openqaworker-arm-1 through 3 sometimes - "worker performance issues" added
Updated by okurz almost 5 years ago
okurz wrote:
[…]
https://gitlab.suse.de/openqa/salt-pillars-openqa/merge_requests/206 created and merged to bump arm-2 again to 30 but arm-3 down to 4 to crosscheck.
I forgot to manually disable the services when reducing the numbers of openQA worker instances. https://stats.openqa-monitor.qa.suse.de/d/1bNU0StZz/automatic-actions?orgId=1&from=1579548585485&to=1579603178052 shows that arm3 failed again but there are still 30 worker instances:
sudo systemctl mask --now openqa-worker@{5..30}
Updated by okurz almost 5 years ago
Today openqaworker-arm-1 acted up. So osd-deployment in https://gitlab.suse.de/openqa/osd-deployment/-/jobs/161879 didn't finish because arm1 isn't/wasn't responsive. So I added retry to the gitlab CI pipeline with https://gitlab.suse.de/openqa/osd-deployment/commit/3af7d93b3ddfd61d4965dae426d3b4d06f1212e3 but still to no avail so far.
The machine is pingable and one can login over ssh but it does not react in time to salt. Being logged in one is greeted with
"BUG: workqueue lockup - pool cpus=15 node=0 flags=0x0 nice=0 stuck for …"
Given the amount of bugs I found with http://fastzilla.suse.de/?q=workqueue+lockup I wonder if I should open another bug, probably not. Looked into this with Santi who was in the room and he suggested me to do https://github.com/os-autoinst/os-autoinst-distri-opensuse/pull/7771/files#diff-0c79f77e8ce8ef2a80d9311b5f67041dR27-R28 so we have stack traces on the console, yay. That is
sysctl -w kernel.softlockup_panic=1
sysctl -p
With https://gitlab.suse.de/openqa/salt-pillars-openqa/merge_requests/217 I propose to reduce the amount of worker instances on arm-1 for the time being as well.
example message with stack trace from journalctl -kf:
Jan 22 10:08:13 openqaworker-arm-1 kernel: INFO: rcu_sched detected stalls on CPUs/tasks:
Jan 22 10:08:13 openqaworker-arm-1 kernel:         23-...: (1 GPs behind) idle=9ca/140000000000000/0 softirq=420584/420588 fqs=724371
Jan 22 10:08:13 openqaworker-arm-1 kernel:         (detected by 8, t=1896528 jiffies, g=400737, c=400736, q=12082145)
Jan 22 10:08:13 openqaworker-arm-1 kernel: Task dump for CPU 23:
Jan 22 10:08:13 openqaworker-arm-1 kernel: lspci           R  running task        0  3725   8151 0x00000002
Jan 22 10:08:13 openqaworker-arm-1 kernel: Call trace:
Jan 22 10:08:13 openqaworker-arm-1 kernel:  ret_from_fork+0x0/0x20
Jan 22 10:08:27 openqaworker-arm-1 kernel: BUG: workqueue lockup - pool cpus=15 node=0 flags=0x0 nice=0 stuck for 7575s!
Jan 22 10:08:27 openqaworker-arm-1 kernel: Showing busy workqueues and worker pools:
Jan 22 10:08:27 openqaworker-arm-1 kernel: workqueue events: flags=0x0
Jan 22 10:08:27 openqaworker-arm-1 kernel:   pwq 30: cpus=15 node=0 flags=0x0 nice=0 active=2/256
Jan 22 10:08:27 openqaworker-arm-1 kernel:     in-flight: 322:wait_rcu_exp_gp
Jan 22 10:08:27 openqaworker-arm-1 kernel:     pending: cache_reap
Jan 22 10:08:27 openqaworker-arm-1 kernel: workqueue mm_percpu_wq: flags=0x8
Jan 22 10:08:27 openqaworker-arm-1 kernel:   pwq 30: cpus=15 node=0 flags=0x0 nice=0 active=1/256
Jan 22 10:08:27 openqaworker-arm-1 kernel:     pending: vmstat_update
Jan 22 10:08:27 openqaworker-arm-1 kernel: workqueue writeback: flags=0x4e
Jan 22 10:08:27 openqaworker-arm-1 kernel:   pwq 96: cpus=0-47 flags=0x4 nice=0 active=1/256
Jan 22 10:08:27 openqaworker-arm-1 kernel:     in-flight: 43459:wb_workfn
Jan 22 10:08:27 openqaworker-arm-1 kernel: workqueue kblockd: flags=0x18
Jan 22 10:08:27 openqaworker-arm-1 kernel:   pwq 65: cpus=32 node=0 flags=0x0 nice=-20 active=1/256
Jan 22 10:08:27 openqaworker-arm-1 kernel:     in-flight: 0:blk_mq_timeout_work
Jan 22 10:08:27 openqaworker-arm-1 kernel:   pwq 3: cpus=1 node=0 flags=0x0 nice=-20 active=1/256
Jan 22 10:08:27 openqaworker-arm-1 kernel:     in-flight: 0:blk_mq_timeout_work
Jan 22 10:08:27 openqaworker-arm-1 kernel: pool 3: cpus=1 node=0 flags=0x0 nice=-20 hung=331s workers=3 idle: 46484 18
Jan 22 10:08:27 openqaworker-arm-1 kernel: pool 30: cpus=15 node=0 flags=0x0 nice=0 hung=7575s workers=2 idle: 101
Jan 22 10:08:27 openqaworker-arm-1 kernel: pool 65: cpus=32 node=0 flags=0x0 nice=-20 hung=3138s workers=3 idle: 1204 204
Jan 22 10:08:27 openqaworker-arm-1 kernel: pool 96: cpus=0-47 flags=0x4 nice=0 hung=0s workers=7 idle: 13255 12971 9864 14174 13163 14060
sometimes there are processes mentioned, as in the above example of lspci:
lspci R running task 0 3725 8151 0x00000002
that's lspci with PID 3725 which is triggered by salt-minion:
root      3150  0.0  0.0  39532 28028 ?        Ss   Jan21   0:01 /usr/bin/python3 /usr/bin/salt-minion
root      8151  0.1  0.0 998512 71104 ?        Sl   Jan21   0:58  \_ /usr/bin/python3 /usr/bin/salt-minion
root      8814  0.0  0.0 123024 28572 ?        S    Jan21   0:00      \_ /usr/bin/python3 /usr/bin/salt-minion
root      3725  0.0  0.0   3476   900 ?        R    04:52   0:00      \_ /sbin/lspci -vmm
I tried to kill lspci but that did not seem to help. Now finally the machine seems to be dead. I power cycled the machine as it does not react to magic sysrq over SoL anymore even. Next time we should follow https://bugzilla.suse.com/show_bug.cgi?id=1106840#c2 , i.e. magic-sysrq-t and record the complete log for a bug report.
EDIT: 2020-02-04: Found again openqaworker-arm-1 with a similar problem, again lspci:
[Tue Feb  4 10:18:34 2020] SFW2-INext-ACC-TCP IN=eth0 OUT= MAC=1c:1b:0d:68:7e:c7:00:de:fb:e3:d7:7c:08:00 SRC=10.163.1.98 DST=10.160.0.245 LEN=60 TOS=0x00 PREC=0x00 TTL=62 ID=62479 DF PROTO=TCP SPT=32952 DPT=22 WINDOW=29200 RES=0x00 SYN URGP=0 OPT (0204051C0402080A1D51F8FA0000000001030307)
[Tue Feb  4 10:19:46 2020] INFO: rcu_sched detected stalls on CPUs/tasks:
[Tue Feb  4 10:19:46 2020]      2-...: (1 GPs behind) idle=fbe/140000000000000/0 softirq=6509573/6509574 fqs=14344932
[Tue Feb  4 10:19:46 2020]      (detected by 43, t=34503583 jiffies, g=6715213, c=6715212, q=231673150)
[Tue Feb  4 10:19:46 2020] Task dump for CPU 2:
[Tue Feb  4 10:19:46 2020] lspci           R  running task        0 26073   7344 0x00000002
[Tue Feb  4 10:19:46 2020] Call trace:
[Tue Feb  4 10:19:46 2020]  __switch_to+0xe4/0x150
[Tue Feb  4 10:19:46 2020]  0xffffffffffffffff
I triggered a complete stack trace of all processes with echo t > /proc/sysrq-trigger and saved the output with dmesg -T > /tmp/dmesg_$(date +%F).
The dmesg log contains complete dmesg output from the current boot, the first suspicious entry:
[584684.843935] nvme nvme0: I/O 328 QID 26 timeout, completion polled
[585160.113773] nvme nvme0: I/O 985 QID 4 timeout, completion polled
[585160.113804] nvme nvme0: I/O 9 QID 23 timeout, completion polled
[591194.945207] nvme nvme0: I/O 209 QID 25 timeout, completion polled
[597368.812505] Synchronous External Abort: synchronous external abort (0x96000210) at 0xffff000018be201c
[597368.812513] Internal error: : 96000210 [#1] SMP
[597368.817161] Modules linked in: nf_log_ipv6 ipt_MASQUERADE nf_nat_masquerade_ipv4 xt_comment xt_TCPMSS nf_log_ipv4 nf_log_common xt_LOG xt_limit iptable_nat nfsv3 nfs_acl rpcsec_gss_krb5 auth_rpcgss nfsv4 dns_resolver nfnetlink_cthelper nfnetlink nfs lockd grace sunrpc fscache scsi_transport_iscsi af_packet tun ip_gre gre ip_tunnel openvswitch nf_nat_ipv6 nf_nat_ipv4 nf_nat ip6t_REJECT nf_conntrack_ipv6 nf_defrag_ipv6 ipt_REJECT xt_physdev br_netfilter bridge stp llc xt_pkttype xt_tcpudp iptable_filter ip6table_mangle nf_conntrack_netbios_ns nf_conntrack_broadcast nf_conntrack_ipv4 nf_defrag_ipv4 ip_tables xt_conntrack nf_conntrack libcrc32c ip6table_filter ip6_tables x_tables nls_iso8859_1 nls_cp437 vfat fat nicvf cavium_ptp nicpf joydev thunder_bgx mdio_thunder mdio_cavium thunderx_edac thunder_xcv
[597368.888273]  cavium_rng_vf cavium_rng uio_pdrv_genirq aes_ce_blk crypto_simd uio cryptd aes_ce_cipher crc32_ce crct10dif_ce ghash_ce aes_arm64 ipmi_ssif ipmi_devintf ipmi_msghandler sha2_ce sha256_arm64 sha1_ce btrfs xor zstd_decompress zstd_compress xxhash zlib_deflate raid6_pq hid_generic usbhid ast xhci_pci i2c_algo_bit xhci_hcd drm_kms_helper syscopyarea sysfillrect sysimgblt fb_sys_fops ttm drm nvme nvme_core gpio_keys drm_panel_orientation_quirks usbcore thunderx_mmc i2c_thunderx i2c_smbus mmc_core dm_mirror dm_region_hash dm_log sg dm_multipath dm_mod scsi_dh_rdac scsi_dh_emc scsi_dh_alua efivarfs
[597368.942048] CPU: 3 PID: 480 Comm: kworker/3:1H Not tainted 4.12.14-lp151.28.36-default #1 openSUSE Leap 15.1
[597368.951977] Hardware name: GIGABYTE R120-T32/MT30-GS1, BIOS T19 09/29/2016
[597368.958963] Workqueue: kblockd blk_mq_timeout_work
[597368.963850] task: ffff803ee7152000 task.stack: ffff803e5fae8000
[597368.969863] pstate: 60000005 (nZCv daif -PAN -UAO)
[597368.974756] pc : nvme_timeout+0x48/0x340 [nvme]
[597368.979382] lr : blk_mq_check_expired+0x140/0x178
[597368.984180] sp : ffff803e5faebc20
[597368.987587] x29: ffff803e5faebc20 x28: ffff803e2c05b800
[597368.992995] x27: 000000000000000e x26: 0000000000000000
[597368.998405] x25: ffff803eedb73810 x24: ffff803e22950000
[597369.003813] x23: ffff803e22950138 x22: ffff803e25ab1380
[597369.009223] x21: ffff803ee735c000 x20: ffff000009339000
[597369.014634] x19: ffff803e22950000 x18: 0000ffff7c2ee000
[597369.020042] x17: 0000ffff7bf687a0 x16: ffff0000082f46d0
[597369.025451] x15: 0000d0dd25e9e532 x14: 0029801fcab7a304
[597369.030870] x13: 000000005e33ec9f x12: 0000000000000018
[597369.036286] x11: 0000000005ea2fbc x10: 0000000000001950
[597369.041695] x9 : ffff803e5faebd80 x8 : ffff803ee71539b0
[597369.047102] x7 : 0000000000000002 x6 : ffff803e22ae94d0
[597369.052513] x5 : ffff803c40d30258 x4 : ffff000009337000
[597369.057922] x3 : 0000000000000001 x2 : ffff000018be201c
[597369.063329] x1 : 0000000000000000 x0 : ffff000009339710
[597369.068739] Process kworker/3:1H (pid: 480, stack limit = 0xffff803e5fae8000)
[597369.075968] Call trace:
[597369.078518]  nvme_timeout+0x48/0x340 [nvme]
[597369.082799]  blk_mq_check_expired+0x140/0x178
[597369.087252]  bt_for_each+0x118/0x140
[597369.090923]  blk_mq_queue_tag_busy_iter+0xa8/0x140
[597369.095808]  blk_mq_timeout_work+0x58/0x118
[597369.100087]  process_one_work+0x1e4/0x430
[597369.104202]  worker_thread+0x50/0x478
[597369.107963]  kthread+0x134/0x138
[597369.111286]  ret_from_fork+0x10/0x20
[597369.114958] Code: f94012f6 f94006d5 f94092a2 91007042 (b9400053)
[597369.121172] ---[ end trace 0dc43e02d03f7b76 ]---
so it could be the NMVE being faulty causing the breakdown though there is quite some time between the timeout and the stack trace which also mentions "nvme_timeout". Next entry:
[599128.041657] Synchronous External Abort: synchronous external abort (0x96000210) at 0xffff000081000000
[599128.050998] Internal error: : 96000210 [#3] SMP
[599128.055626] Modules linked in: nf_log_ipv6 ipt_MASQUERADE nf_nat_masquerade_ipv4 xt_comment xt_TCPMSS nf_log_ipv4 nf_log_common xt_LOG xt_limit iptable_nat nfsv3 nfs_acl rpcsec_gss_krb5 auth_rpcgss nfsv4 dns_resolver nfnetlink_cthelper nfnetlink nfs lockd grace sunrpc fscache scsi_transport_iscsi af_packet tun ip_gre gre ip_tunnel openvswitch nf_nat_ipv6 nf_nat_ipv4 nf_nat ip6t_REJECT nf_conntrack_ipv6 nf_defrag_ipv6 ipt_REJECT xt_physdev br_netfilter bridge stp llc xt_pkttype xt_tcpudp iptable_filter ip6table_mangle nf_conntrack_netbios_ns nf_conntrack_broadcast nf_conntrack_ipv4 nf_defrag_ipv4 ip_tables xt_conntrack nf_conntrack libcrc32c ip6table_filter ip6_tables x_tables nls_iso8859_1 nls_cp437 vfat fat nicvf cavium_ptp nicpf joydev thunder_bgx mdio_thunder mdio_cavium thunderx_edac thunder_xcv
[599128.126717]  cavium_rng_vf cavium_rng uio_pdrv_genirq aes_ce_blk crypto_simd uio cryptd aes_ce_cipher crc32_ce crct10dif_ce ghash_ce aes_arm64 ipmi_ssif ipmi_devintf ipmi_msghandler sha2_ce sha256_arm64 sha1_ce btrfs xor zstd_decompress zstd_compress xxhash zlib_deflate raid6_pq hid_generic usbhid ast xhci_pci i2c_algo_bit xhci_hcd drm_kms_helper syscopyarea sysfillrect sysimgblt fb_sys_fops ttm drm nvme nvme_core gpio_keys drm_panel_orientation_quirks usbcore thunderx_mmc i2c_thunderx i2c_smbus mmc_core dm_mirror dm_region_hash dm_log sg dm_multipath dm_mod scsi_dh_rdac scsi_dh_emc scsi_dh_alua efivarfs
[599128.180483] CPU: 44 PID: 20557 Comm: lspci Tainted: G      D          4.12.14-lp151.28.36-default #1 openSUSE Leap 15.1
[599128.191358] Hardware name: GIGABYTE R120-T32/MT30-GS1, BIOS T19 09/29/2016
[599128.198327] task: ffff803c3c186100 task.stack: ffff803c420e0000
[599128.204340] pstate: 20000085 (nzCv daIf -PAN -UAO)
[599128.209228] pc : pci_generic_config_read+0x5c/0xf0
[599128.214112] lr : pci_generic_config_read+0x48/0xf0
[599128.218995] sp : ffff803c420e3c00
[599128.222402] x29: ffff803c420e3c00 x28: 0000000000000000
[599128.227810] x27: ffff803c3c1c1b00 x26: 0000000000000004
[599128.233217] x25: ffff803c3c1c1b00 x24: 000000000000000f
[599128.238624] x23: 0000000000000000 x22: 0000000000000000
[599128.244031] x21: ffff803c420e3cbc x20: 0000000000000004
[599128.249438] x19: ffff803ee7543800 x18: 0000fffffb2ad007
[599128.254846] x17: 0000ffff9ea7c970 x16: ffff0000082dae98
[599128.260265] x15: 000000000000000a x14: 0000000000000000
[599128.265675] x13: 0000000000000000 x12: 0000000000000020
[599128.271083] x11: 0000fffffb2ad008 x10: 0000000000000000
[599128.276490] x9 : 0000ffff9ea2b5d8 x8 : 0000000000000043
[599128.281897] x7 : 000000000000008f x6 : 00000000000000c7
[599128.287304] x5 : 0000000000000010 x4 : 000000000000008f
[599128.292711] x3 : ffff000080000000 x2 : 0000000000000090
[599128.298118] x1 : 0000000001000000 x0 : ffff000081000000
[599128.303528] Process lspci (pid: 20557, stack limit = 0xffff803c420e0000)
[599128.310322] Call trace:
[599128.312866]  pci_generic_config_read+0x5c/0xf0
[599128.317408]  thunder_pem_config_read+0x78/0x268
[599128.322032]  pci_user_read_config_dword+0x70/0x108
[599128.326918]  pci_read_config+0xdc/0x228
[599128.330848]  sysfs_kf_bin_read+0x6c/0xa8
[599128.334865]  kernfs_fop_read+0xa8/0x208
[599128.338796]  __vfs_read+0x48/0x140
[599128.342292]  vfs_read+0x94/0x150
[599128.345614]  SyS_pread64+0x8c/0xa8
[599128.349111]  el0_svc_naked+0x44/0x48
[599128.352781] Code: 7100069f 54000180 71000a9f 54000280 (b9400001)
[599128.359002] ---[ end trace 0dc43e02d03f7b78 ]---
one after that, some time later:
[602781.468092] INFO: rcu_sched detected stalls on CPUs/tasks:
[602781.473695]         2-...: (1 GPs behind) idle=fbe/140000000000000/0 softirq=6509573/6509574 fqs=2690
[602781.482486]         (detected by 14, t=6003 jiffies, g=6715213, c=6715212, q=40961)
[602781.489635] Task dump for CPU 2:
[602781.492956] lspci           R  running task        0 26073   7344 0x00000002
[602781.500102] Call trace:
[602781.502649]  __switch_to+0xe4/0x150
[602781.506231]  0xffffffffffffffff
[602961.514252] INFO: rcu_sched detected stalls on CPUs/tasks:
[602961.519855]         2-...: (1 GPs behind) idle=fbe/140000000000000/0 softirq=6509573/6509574 fqs=10747
[602961.528733]         (detected by 3, t=24008 jiffies, g=6715213, c=6715212, q=163507)
[602961.535968] Task dump for CPU 2:
[602961.539289] lspci           R  running task        0 26073   7344 0x00000002
[602961.546435] Call trace:
[602961.548981]  __switch_to+0xe4/0x150
[602961.552564]  0xffffffffffffffff
which then repeats. I reported the specific issue as https://bugzilla.opensuse.org/show_bug.cgi?id=1162612 and power cycled the machine.
Calling /sbin/lspci -vmm manually did not show any problem. The command succeeds within a second and seems to be fine.
Updated by okurz almost 5 years ago
- Priority changed from High to Low
No reaction on the bug yet. Reducing prio to "low" as our workarounds are good enough. We have other tickets for the reduced amount of worker instances as well. Lately at least openqaworker-arm-3 had trouble to come up after reboot due to my work on #19238 so let's give it more time to have unpolluted experiences.
Updated by okurz almost 5 years ago
openqaworker-arm-2 is problematic today. https://stats.openqa-monitor.qa.suse.de/d/1bNU0StZz/automatic-actions?orgId=1&from=now-7d&to=now does not show a problem for openqaworker-arm-2, it is pingable but does not react when trying to login over ssh. could connect over IPMI SOL and call magic sysrq commands to find out what is blocking the host. Only a power reset mitigates the issue for now.
Attached a log of the IPMI SOL session with all output from sysrq-w, sysrq-t, etc. Then did power reset over IPMI. Reported as boo#1165642
Updated by okurz almost 5 years ago
osd deploy failed on arm1 being not responsive. if you look at ps auxf | grep '\<D\>' you will find some processes which are "I/O stuck", also lspci.
Over ipmi SOL I pressed the keys "~B w" to show currently blocked tasks. I will upload the log to the ticket about flaky arm workers and now power reset.
I recorded this in https://bugzilla.opensuse.org/show_bug.cgi?id=1162612#c1
Updated by okurz almost 5 years ago
- Copied to action #64580: Detect and recover from I/O blocked worker machines, e.g. openqaworker-arm-{1,2,3}.suse.de added
Updated by okurz almost 5 years ago
- Due date set to 2020-06-30
https://bugzilla.opensuse.org/show_bug.cgi?id=1165642#c1 suggests to use KOTD for crosschecking – I could have expected that :)
Following https://en.opensuse.org/openSUSE:Kernel_of_the_day#Following_Kernel_of_the_Day I did on openqaworker-arm-1 (just a single one for crosschecking):
zypper ar -p 100 http://download.opensuse.org/repositories/Kernel:/HEAD/ARM KOTD && zypper --gpg-auto-import-keys ref -r KOTD && zypper -n in -f -r KOTD kernel-default && reboot
This installed kernel-default-5.6.rc6-1.1.g5c2f002.aarch64 now.
For testing:
$ openqa-clone-job --skip-chained-deps --within-instance https://openqa.suse.de/tests/4012178 WORKER_CLASS=openqaworker-arm-1 _BUILD=poo41882 TEST=poo41882_okurz_boot_to_snapshot_new_kernel_on_worker
Created job #4014364: sle-15-SP2-Online-aarch64-Build161.1-boot_to_snapshot@aarch64 -> https://openqa.suse.de/t4014364
passed, so the new kernel is able to execute openQA tests successfully in general.
Setting "due date" to 2020-06-30. At the latest at this time if openqaworker-arm-1 never showed a problem of I/O block again until this date we can assume that kernel-default-5.6.rc6-1.1.g5c2f002.aarch64 has a fix that the older kernel is missing.
Updated by okurz over 4 years ago
- Status changed from Feedback to In Progress
Running an experiment as mentioned in https://bugzilla.opensuse.org/show_bug.cgi?id=1165642#c3 . On openqaworker-arm-1 I have triggered systemctl start btrfs-scrub btrfs-balance btrfs-trim fstrim and monitored running openQA jobs on the active openqa worker instances 1:1 , 1:2, 1:3, 1:1 . System is still up and jobs were fine. No problem so far. Retriggered with for i in {1..20}; do systemctl start btrfs-scrub btrfs-balance btrfs-trim fstrim ; sleep 300; done. Started the same on openqaworker-arm-2, running 4.12.14-lp151.28.40-default , monitoring jobs.
EDIT: openqaworker-arm-1 succeeded, openqaworker-arm-2 died and was automatically reset by the automatic detection based on https://stats.openqa-monitor.qa.suse.de/d/1bNU0StZz/automatic-actions?orgId=1&from=now-7d&to=now , hm. Trying again with for i in {1..20}; do msg="## https://progress.opensuse.org/issues/41882#note-34: Run $i" && logger $msg && echo $msg && systemctl start btrfs-scrub btrfs-balance btrfs-trim fstrim ; sleep 300; done. On the next morning openqaworker-arm-2 was rebooted automatically and openqaworker-arm-1 is in the stuck state but it's running the more recent kernel. Seems like it did not provide a fix. Will report in bug. -> https://bugzilla.opensuse.org/show_bug.cgi?id=1165642#c5
EDIT: I triggered a crash on openqaworker-arm-1 to reboot it faster. sysctl kernel.softlockup_panic kernel.hardlockup_panic returns kernel.softlockup_panic = 0 so we can set this to "1" to trigger a panic instead. I created https://gitlab.suse.de/openqa/salt-states-openqa/-/merge_requests/291 to apply that change persistently. Also applied it temporarily on openqaworker-arm-1 now and restarted the experiment, running in a screen session right now.
EDIT: did not fail on openqaworker-arm-1, restarted with 40 runs. same on openqaworker-arm-2
EDIT: 40 jobs passed on openqaworker-arm-1, still fine. openqaworker-arm-2 died after 24 jobs. So this feels like KOTD could be better however arm-2 is more loaded with more worker instances running compared to arm-1.
EDIT: 2020-03-31: openqaworker-arm-2 was down again, openqaworker-arm-1 is still ok since some days. Installing KOTD on openqaworker-arm-2 now, currently version kernel-default-5.6.0-2.1.g46fab61 . Retriggered experiment with 40 runs on both openqaworker-arm-1 and openqaworker-arm-2
Updated by okurz over 4 years ago
Seems like arm workers still crash from time to time. Right now openqaworker-arm-2 is back up since 14h but kdump failed because of grub parameters not reserving memory for crash kernel and openqaworker-arm-1 is currently down.
Updated by okurz over 4 years ago
openqaworker-arm-1 seemed to have crashed uncontrolled yesterday:
Apr 06 11:15:43 openqaworker-arm-1 worker[5823]: [debug] [pid:5823] REST-API call: POST http://openqa.suse.de/api/v1/jobs/4091982/status
Apr 06 11:15:47 openqaworker-arm-1 worker[5829]: [debug] [pid:5829] REST-API call: POST http://openqa.suse.de/api/v1/jobs/4091951/status
-- Reboot --
Apr 06 11:20:48 openqaworker-arm-1 kernel: Booting Linux on physical CPU 0x0000000000 [0x431f0a11]
from journal. So suddenly no output and after 5m machine came up again.
Updated by okurz over 4 years ago
This morning I checked and found openqaworker-arm-2 suddenly dying. In journal:
Apr 09 00:02:06 openqaworker-arm-2 worker[6417]: [debug] [pid:14612] Optimizing /var/lib/openqa/pool/23/testresults/grub_test_snapshot-60.png                                                                       │·······································································
Apr 09 00:02:06 openqaworker-arm-2 worker[6414]: [debug] [pid:17877] Optimizing /var/lib/openqa/pool/1/testresults/first_boot-8.png                                                                                 │·······································································
Apr 09 00:02:07 openqaworker-arm-2 worker[6496]: [debug] [pid:19376] Uploading artefact grub_test_snapshot-62.png as c87eb8cb67729a9749458f7b2a63fb8f                                                               │·······································································
-- Reboot --                                                                                                                                                                                                        │·······································································
Apr 09 01:07:12 openqaworker-arm-2 kernel: Booting Linux on physical CPU 0x0000000000 [0x431f0a11]                                                                                                                  │·······································································
Apr 09 01:07:12 openqaworker-arm-2 kernel: Linux version 5.6.0-2.g46fab61-default (geeko@buildhost) (gcc version 9.2.1 20200306 [revision c5edde44f5b17b4891f17a63517f355bbf89e7d3] (SUSE Linux)) #1 SMP Mon Mar 30>│·······································································
Apr 09 01:07:12 openqaworker-arm-2 kernel: Machine model: Cavium ThunderX CN88XX board
So also just normal operation and suddenly machine does not write anything to journal anymore, then our automatic power cycling recovers the machine. No output in /var/crash so kdump did either not detect anything or could not record anything.
TODO we should check if kdump is able to save a dump and also send an email, e.g. during times when the worker is not loaded, trigger a crash. I configured relay.suse.de as the email target to send notifications for crashes to.
The FSP (service processor) for the ARM machines also offers a webui which can be helpful to configure more and also show history, e.g. of temperatures. https://openqaworker-arm-2-ipmi.suse.de/index.html with same username and password as IPMI. There is a time graph for temperature, unfortunately not for other monitoring values. Temperatures during last crash looked normal, no exceeding limits etc. Over http://mailman.suse.de/mailman/admin/osd-admins/privacy/sender I enabled all senders to send emails to osd-admins@suse.de and I have configured email alerts in https://openqaworker-arm-2-ipmi.suse.de/index.html to send to osd-admins@suse.de in case of any alerts. Maybe we will also receive emails from the automatic power cycles. Did the same over https://openqaworker-arm-1-ipmi.suse.de/index.html
If kdump on /var/crash (btrfs) does not work, we could use the free disk /dev/sdb and e.g. save to an ext2/ext4 or something. I did that now by mounting /dev/sdb1 to /var/crash . I don't know how the kdump kernel will use the moint point though. Added
UUID=bbd2c400-bef1-433a-a227-5bf53197aa60 /var/crash ext4 defaults 0 0
in /etc/fstab.
On osd I started a screen session as root running cd /home && ipmitool -I lanplus -H openqaworker-arm-2-ipmi.suse.de -U ADMIN -P ADMIN sol activate 2>&1 | tee -a arm2.log and correspondingly for arm1. This might allow us to see if there is anything shown on the serial port in case of problems. Or actually I changed this to cd /home && ipmitool -I lanplus -H openqaworker-arm-2-ipmi.suse.de -U ADMIN -P ADMIN sol activate 2>&1 | ts | tee -a arm2.log with "ts" from "moreutils" so that we have a timestamp (in CET/CEST) to synchronize on.
Updated by okurz over 4 years ago
https://stats.openqa-monitor.qa.suse.de/d/1bNU0StZz/automatic-actions?orgId=1 shows that openqaworker-arm-2 was done since some days. https://gitlab.suse.de/openqa/grafana-webhook-actions/-/jobs/195962 successfully recovered the machine just 2h earlier. https://gitlab.suse.de/openqa/grafana-webhook-actions/-/jobs/195903 is an earlier job but mentions "12:XX" so a later time still? But anyway, the machine did not come up or was not actually triggered for power cycle here. I did that now manually. something is wrong here … The machine is still running a more recent kernel KOTD.
There are no crashes recorded on the machine in /var/crash. But we were running IPMI sol sessions attached in a screen session on osd. The session for openqaworker-arm-1 is still active but for openqaworker-arm-2 the BMC connection showed no update after 2020-04-22, only after sending the return key it failed and disconnected:
Apr 22 10:03:58 [13583.523207] SFW2-INext-ACC-TCP IN=eth1 OUT= MAC=1c:1b:0d:68:ee:4d:52:54:00:49:b7:68:08:00 SRC=10.160.0.207 DST=10.160.0.227 LEN=60 TOS=0x00 PREC=0x00 TTL=64 ID=56424 DF PROTO=TCP SPT=55746 DPT=20283 WINDOW=29200 RES=0x00 SYN URGP=0 OPT (020405B40402080A815A9BA50000000001030307)
Apr 26 13:42:30 Error sending SOL data: FAIL
Apr 26 13:42:30 SOL session closed by BM
great :(
Updated by rfan1 over 4 years ago
Hello Oliver,
Paste some msgs here (I have sent you a mail as well)
There might be some potential risk for the root disk's driver, I can see the below trace log (I didn't see such in openqaworker-arm-1)
Apr 27 05:37:29 openqaworker-arm-2 kernel: ahci 0005:00:08.0: SSS flag set, parallel bus scan disabled
Apr 27 05:37:29 openqaworker-arm-2 kernel: ahci 0005:00:08.0: AHCI 0001.0300 32 slots 1 ports 6 Gbps 0x1 impl SATA mode
Apr 27 05:37:29 openqaworker-arm-2 kernel: ahci 0005:00:08.0: flags: 64bit ncq sntf ilck stag pm led clo only pmp fbs pio slum part ccc apst
Apr 27 05:37:29 openqaworker-arm-2 kernel: ahci 0005:00:08.0: port 0 is not capable of FBS
Apr 27 05:37:29 openqaworker-arm-2 kernel: ------------[ cut here ]------------
Apr 27 05:37:29 openqaworker-arm-2 kernel: WARNING: CPU: 2 PID: 1 at drivers/ata/libata-core.c:6649 ata_host_activate+0x134/0x148
Apr 27 05:37:29 openqaworker-arm-2 kernel: Modules linked in:
Apr 27 05:37:29 openqaworker-arm-2 kernel: CPU: 2 PID: 1 Comm: swapper/0 Not tainted 5.6.0-2.g46fab61-default #1 openSUSE Tumbleweed (unreleased)
Apr 27 05:37:29 openqaworker-arm-2 kernel: Hardware name: GIGABYTE R270-T64-00/MT60-SC4-00, BIOS T32 03/03/2017
Apr 27 05:37:29 openqaworker-arm-2 kernel: pstate: 60000005 (nZCv daif -PAN -UAO)
Apr 27 05:37:29 openqaworker-arm-2 kernel: pc : ata_host_activate+0x134/0x148
Apr 27 05:37:29 openqaworker-arm-2 kernel: lr : ata_host_activate+0x6c/0x148
Apr 27 05:37:29 openqaworker-arm-2 kernel: sp : ffff8000126db9e0
Apr 27 05:37:29 openqaworker-arm-2 kernel: x29: ffff8000126db9e0 x28: ffff010feb8bbc80
Apr 27 05:37:29 openqaworker-arm-2 kernel: x27: ffff010febac8b00 x26: 0000000000000001
Apr 27 05:37:29 openqaworker-arm-2 kernel: x25: ffff010f84c470b0 x24: 0000000000000080
Apr 27 05:37:29 openqaworker-arm-2 kernel: x23: ffff800011a731c0 x22: ffff800010946100
Apr 27 05:37:29 openqaworker-arm-2 kernel: x21: 0000000000000000 x20: ffff010febac8b00
Apr 27 05:37:29 openqaworker-arm-2 kernel: x19: 0000000000000000 x18: 0000000000000001I noticed that we have 2 entries for '/var/crash' directory in '/etc/fstab' file
UUID=3a766df3-65f9-47b8-b75e-d737b94b5370 /var/crash btrfs subvol=@/var/crash 0 0
UUID=bbd2c400-bef1-433a-a227-5bf53197aa60 /var/crash ext4 defaults 0 0 ################(/dev/sdb1)
Apr 27 05:37:36 openqaworker-arm-2 kernel: printk: systemd: 17 output lines suppressed due to ratelimiting
Apr 27 05:37:36 openqaworker-arm-2 systemd-fstab-generator[1158]: Failed to create mount unit file /run/systemd/generator/var-crash.mount, as it already exists. Du>
Apr 27 05:37:36 openqaworker-arm-2 systemd-journald[1200]: Journal started
This may impact the kdump function once system crash.(save crash dump file to /var/crash dir)
Updated by okurz over 4 years ago
Hi @rfan1, thanks for looking into this as well. I have fixed the duplicate mount point for /var/crash on openqaworker-arm-2. Maybe this helps on next crashes.
Updated by okurz over 4 years ago
https://stats.openqa-monitor.qa.suse.de/d/1bNU0StZz/automatic-actions?orgId=1&from=1587506400000&to=1588197599000 shows that there had been way more crashes on openqaworker-arm-2 compared to other machines. Also zluo showed me https://openqa.suse.de/tests/4179769#next_previous with a lot of clamav failures. zluo seemed to never follow my suggestion to group tests consistently and also distinguish test results by WORKER_CLASS but still the results are significant: clamav fails very often if not always to start the systemd service for "clamd" within time – systemd internal timeout, not test timeout – or even fails to boot. This could be a transient problem but still an indication that could also point to "too many worker instances". So I will reduce the instances from 30 to 20.
On the other hand, one of the original experiments was if reducing the amount of worker instances can prevent hard uncontrolled system crashes. As openqaworker-arm-1 and openqaworker-arm-3 are running with only 4 worker instances each we need to understand if we still see uncontrolled system crashes. As since #41882#note-37 I log the SOL of all three machines I can crosscheck the output against the last "system offline" events as visible on https://stats.openqa-monitor.qa.suse.de/d/1bNU0StZz/automatic-actions?orgId=1&from=1587506400000&to=1588197599000 and also check the BMC event logs. openqaworker-arm-1 shows the latest event at "2020-04-26 18:20:50" , the "System Event Log" on https://openqaworker-arm-1-ipmi.suse.de/index.html shows no relevant entries for the crash but at least for the triggered boots:
2020-04-25 08:58:52 (UTC+0000)  System Software event: OS Boot sensor, boot completed - boot device not specific was asserted
2020-04-26 17:16:05 (UTC+0000)  System Software event: System Event sensor, OEM System Boot Event was asserted
2020-04-26 17:16:20 (UTC+0000)  System Software event: System Event sensor, Timestamp Clock Synch was asserted
2020-04-26 17:22:46 (UTC+0000)  System Software event: System Event sensor, Timestamp Clock Synch was asserted
2020-04-26 17:23:53 (UTC+0000)  System Software event: OS Boot sensor, boot completed - boot device not specific was asserted
For the time stamp keep in mind that the automatic reboot trigger triggers at 1h after detecting an event, i.e. about "2020-04-26 19:20 localtime" or "2020-04-26 17:20 UTC". The "System Event Log" mentions "17:16 UTC".
The corresponding output on SOL:
Apr 26 15:40:13 [103272.421343] SFW2-INext-DROP-DEFLT IN=eth0 OUT= MAC=1c:1b:0d:68:7e:c7:00:16:3e:48:17:ff:08:00 SRC=10.160.0.1 DST=10.160.0.245 LEN=84 TOS=0x00 PREC=0x00 TTL=64 ID=61047 DF PROTO=UDP SPT=427 DPT=49834 LEN=64
…
Apr 26 17:27:58 [109737.676351] SFW2-INext-DROP-DEFLT IN=eth0 OUT= MAC=1c:1b:0d:68:7e:c7:52:54:00:d8:47:5c:08:00 SRC=10.160.0.10 DST=10.160.0.245 LEN=103 TOS=0x00 PREC=0x00 TTL=64 ID=3062 DF PROTO=UDP SPT=427 DPT=45688 LEN=83
Apr 26 19:21:13 ^@^@^@377
Apr 26 19:21:13
Apr 26 19:21:13
Apr 26 19:21:13 Cavium SOC
Apr 26 19:21:13 Locking L2 cache
Apr 26 19:21:13 PASS: CRC32 verification
Apr 26 19:21:13 Transferring to thread UART: Baut rate configuration: 115200
Apr 26 19:21:13 Read CPLD data a
Apr 26 19:21:13 Set CPLD data a
Apr 26 19:21:13 Check CPLD data a
Apr 26 19:21:13 =========================
Apr 26 19:21:13 Cavium THUNDERX Boot Stub
so only irrelevant firewall messages, some unparsed bytes at 19:21:13 and then the bootup at the same time. So I understand that there was simply no output at all at the time of crash again.
On openqaworker-arm-3 the last detected event is from 2020-04-28 15:17:51 and we do see a message on SOL:
Apr 28 15:17:30 [256898.042772] SError Interrupt on CPU81, code 0xbe000000 -- SError
Apr 28 15:17:30 [256898.042775] CPU: 81 PID: 24143 Comm: worker Tainted: G        W        4.12.14-lp151.28.44-default #1 openSUSE Leap 15.1
Apr 28 15:17:30 [256898.042777] Hardware name: GIGABYTE R270-T64-00/MT60-SC4-00, BIOS T32 03/03/2017
Apr 28 15:17:30 [256898.042778] task: ffff810cc501c080 task.stack: ffff810cc829c000
Apr 28 15:17:30 [256898.042779] pstate: 60000005 (nZCv daif -PAN -UAO)
Apr 28 15:17:30 [256898.042780] pc : ptep_set_access_flags+0xc0/0x100
Apr 28 15:17:30 [256898.042781] lr : 0xe0010bbfeb9bd3
Apr 28 15:17:30 [256898.042782] sp : ffff810cc829fca0
Apr 28 15:17:30 [256898.042784] x29: ffff810cc829fca0 x28: ffff810cc501c080
Apr 28 15:17:30 [256898.042787] x27: ffff810cc2443468 x26: 0000000000000007
Apr 28 15:17:30 [256898.042789] x25: ffff810f6f63d0c8 x24: 0000000000000054
Apr 28 15:17:30 [256898.042792] x23: ffff810cc2443400 x22: ffff810f6f63d0c8
Apr 28 15:17:30 [256898.042794] x21: 62c6000aaab37e3b x20: 00e0010bbfeb9fd3
Apr 28 15:17:30 [256898.042796] x19: ffff810cce57b1d8 x18: 0000000000000000
Apr 28 15:17:30 [256898.042799] x17: 0000ffffa9823238 x16: 0000aaaaeabfd350
Apr 28 15:17:30 [256898.042801] x15: 000040c4034d32e5 x14: 0000000000000000
Apr 28 15:17:30 [256898.042803] x13: 8080c08013012026 x12: 0000000000000000
Apr 28 15:17:30 [256898.042806] x11: 0000000000000040 x10: 000000000000000e
Apr 28 15:17:30 [256898.042808] x9 : 000000000000ff00 x8 : 0000ffffa937bac8
Apr 28 15:17:30 [256898.042810] x7 : 0000aaab1bb72d48 x6 : 0000000000000024
Apr 28 15:17:30 [256898.042813] x5 : 00e0010bbfeb9b53 x4 : 00e0010bbfeb9b53
Apr 28 15:17:30 [256898.042815] x3 : 0080000000000400 x2 : 00e0010bbfeb9fd3
Apr 28 15:17:30 [256898.042817] x1 : 00e0010bbfeb9bd3 x0 : 00000000001262c6
Apr 28 15:17:30 [256898.042820] Kernel panic - not syncing: Asynchronous SError Interrupt
Apr 28 15:17:30 [256898.042822] CPU: 81 PID: 24143 Comm: worker Tainted: G        W        4.12.14-lp151.28.44-default #1 openSUSE Leap 15.1
Apr 28 15:17:30 [256898.042823] Hardware name: GIGABYTE R270-T64-00/MT60-SC4-00, BIOS T32 03/03/2017
Apr 28 15:17:30 [256898.042824] Call trace:
Apr 28 15:17:30 [256898.042825]  dump_backtrace+0x0/0x188
Apr 28 15:17:30 [256898.042826]  show_stack+0x24/0x30
Apr 28 15:17:30 [256898.042827]  dump_stack+0x90/0xb0
Apr 28 15:17:30 [256898.042828]  panic+0x114/0x28c
Apr 28 15:17:30 [256898.042828]  nmi_panic+0x7c/0x80
Apr 28 15:17:30 [256898.042829]  arm64_serror_panic+0x80/0x90
Apr 28 15:17:30 [256898.042830]  __pte_error+0x0/0x50
Apr 28 15:17:30 [256898.042831]  el1_error+0x7c/0xdc
Apr 28 15:17:30 [256898.042832]  ptep_set_access_flags+0xc0/0x100
Apr 28 15:17:30 [256898.042833]  __handle_mm_fault+0x204/0x500
Apr 28 15:17:30 [256898.042834]  handle_mm_fault+0xd4/0x178
Apr 28 15:17:30 [256898.042835]  do_page_fault+0x1a0/0x448
Apr 28 15:17:30 [256898.042836]  do_mem_abort+0x54/0xb0
Apr 28 15:17:30 [256898.042837]  el0_da+0x24/0x28
Apr 28 15:17:30 [256899.126203] SError Interrupt on CPU6, code 0xbe000000 -- SError
Apr 28 15:17:30 [256899.126205] CPU: 6 PID: 19627 Comm: /usr/bin/isotov Tainted: G        W        4.12.14-lp151.28.44-default #1 openSUSE Leap 15.1
Apr 28 15:17:30 [256899.126207] Hardware name: GIGABYTE R270-T64-00/MT60-SC4-00, BIOS T32 03/03/2017
Apr 28 15:17:30 [256899.126208] task: ffff810cbfc24080 task.stack: ffff810cc9564000
Apr 28 15:17:30 [256899.126209] pstate: 60000005 (nZCv daif -PAN -UAO)
Apr 28 15:17:30 [256899.126210] pc : ptep_clear_flush+0x88/0xd8
Apr 28 15:17:30 [256899.126211] lr : wp_page_copy+0x298/0x6c0
Apr 28 15:17:30 [256899.126212] sp : ffff810cc9567be0
Apr 28 15:17:30 [256899.126213] x29: ffff810cc9567be0 x28: 0000aaaafc866000
Apr 28 15:17:30 [256899.126216] x27: ffff810cb93f8330 x26: ffff810cc1142c00
Apr 28 15:17:30 [256899.126218] x25: 0000aaaafc866000 x24: ffff810cc1142c00
Apr 28 15:17:30 [256899.126220] x23: 00e801048f9ccf53 x22: ffff810f56d2a708
Apr 28 15:17:30 [256899.126223] x21: ffff810f56d2a708 x20: 0000000aaaafc866
Apr 28 15:17:30 [256899.126225] x19: ffff810cb93f8330 x18: 0000000000000000
Apr 28 15:17:30 [256899.126228] x17: 0000aaaafc85f420 x16: 0000aaaafc8693c0
Apr 28 15:17:30 [256899.126230] x15: 4000000b00000001 x14: 0000aaaafc863880
Apr 28 15:17:30 [256899.126232] x13: 0000000000000032 x12: 0000110100000001
Apr 28 15:17:30 [256899.126235] x11: 0000aaaafc866fb8 x10: 0000aaaafc867fd0
Apr 28 15:17:30 [256899.126237] x9 : 1000440300000001 x8 : 0000aaaafc85f440
Apr 28 15:17:30 [256899.126239] x7 : 0000000000000029 x6 : 0000110100000001
Apr 28 15:17:30 [256899.126242] x5 : 0088000000000000 x4 : 00e0000e8ed2ff53
Apr 28 15:17:30 [256899.126244] x3 : 00e001048f9ccfd3 x2 : 0000000000000000
Apr 28 15:17:30 [256899.126247] x1 : 3804000aaaafc866 x0 : 00e0000e8ed2ffd3
Apr 28 15:17:30 [256899.126271] SMP: stopping secondary CPUs
Apr 28 15:17:30 [256899.126272] SMP: failed to stop secondary CPUs 1,6,48,81,84-85
Apr 28 15:17:30 [256899.126273] Kernel Offset: disabled
Apr 28 15:17:30 [256899.126274] CPU features: 0x01,04101128
Apr 28 15:17:30 [256899.126275] Memory Limit: none
Apr 28 15:17:30 [256899.126277] SError Interrupt on CPU85, code 0xbe000000 -- SError
Apr 28 15:17:30 [256899.126279] CPU: 85 PID: 23855 Comm: worker Tainted: G        W        4.12.14-lp151.28.44-default #1 openSUSE Leap 15.1
Apr 28 15:17:30 [256899.126280] Hardware name: GIGABYTE R270-T64-00/MT60-SC4-00, BIOS T32 03/03/2017
Apr 28 15:17:30 [256899.126281] task: ffff810cc9f0a180 task.stack: ffff810cc99b4000
Apr 28 15:17:30 [256899.126282] pstate: 60000005 (nZCv daif -PAN -UAO)
Apr 28 15:17:30 [256899.126283] pc : ptep_set_access_flags+0xc0/0x100
Apr 28 15:17:30 [256899.126284] lr : 0xe0000a0c000fd1
Apr 28 15:17:30 [256899.126285] sp : ffff810cc99b7c30
Apr 28 15:17:30 [256899.126286] x29: ffff810cc99b7c30 x28: ffff810cc9f0a180
Apr 28 15:17:30 [256899.126288] x27: ffff000008d32000 x26: 0000000000000008
Apr 28 15:17:30 [256899.126291] x25: ffff7e0000000000 x24: ffff810f6b56ced8
Apr 28 15:17:30 [256899.126293] x23: ffff00000933a000 x22: ffff810f6b56ced8
Apr 28 15:17:30 [256899.126295] x21: 5f3e000aaab2f400 x20: 00e8000a0c000f51
Apr 28 15:17:30 [256899.126298] x19: ffff810cdab62bd0 x18: 0000000000000000
Apr 28 15:17:30 [256899.126300] x17: 0000ffffafddac80 x16: 0000aaaae4c21020
Apr 28 15:17:30 [256899.126302] x15: 000089a652d558cc x14: 0000000000000000
Apr 28 15:17:30 [256899.126305] x13: 0d4b4f2030303220 x12: 312e312f50545448
Apr 28 15:17:30 [256899.126307] x11: 0000aaab233d1eb0 x10: 00000000c6cf1b21
Apr 28 15:17:30 [256899.126309] x9 : 0000000000000009 x8 : 0000aaab24a44d00
Apr 28 15:17:31 [256899.126311] x7 : 41203832202c6575 x6 : 54203a657461440a
Apr 28 15:17:31 [256899.126314] x5 : 0000000000100073 x4 : 00e0000a0c000f51
Apr 28 15:17:31 [256899.126316] x3 : 0088000000000480 x2 : 00e8000a0c000f51
Apr 28 15:17:31 [256899.126318] x1 : 00e0000a0c000fd1 x0 : 0000000000125f3e
Apr 28 15:17:31 [256899.725248] ---[ end Kernel panic - not syncing: Asynchronous SError Interrupt
Apr 28 16:18:35 �
openqaworker-arm-2 had the most events in the past days, on openqaworker-arm-2 I checked 6 events all from the last 48h, the complete SOL is available and found no relevant information, similar to the entry recorded for openqaworker-arm-1 .
What we can use: grep --text -B 10 'Cavium SOC' openqaworker-arm-?.log | less
With this I can find one more event with maybe more information "openqaworker-arm-1.log-Apr 25 08:38:12":
Apr 25 08:38:12 [37653.048882] Internal error: synchronous external abort: 96000210 [#1] SMP
Apr 25 08:38:12 [37653.060886] Modules linked in: nf_log_ipv6 xt_MASQUERADE xt_comment xt_TCPMSS nf_log_ipv4 nf_log_common xt_LOG xt_limit iptable_nat nfsv3 nfs_acl rpcsec_gss_krb5 auth_rpcgss nfsv4 dns_resolver nfs lockd grace sunrpc fscache scsi_transport_iscsi nfnetlink_cthelper nfnetlink af_packet tun iscsi_ibft iscsi_boot_sysfs rfkill ip_gre ip_tunnel gre openvswitch nsh nf_conncount nf_nat ip6t_REJECT nf_reject_ipv6 ipt_REJECT nf_reject_ipv4 br_netfilter bridge stp llc xt_physdev xt_pkttype xt_tcpudp iptable_filter ip6table_mangle nf_conntrack_netbios_ns nf_conntrack_broadcast ip_tables xt_conntrack nf_conntrack nf_defrag_ipv6 nf_defrag_ipv4 ip6table_filter ip6_tables x_tables nls_iso8859_1 nls_cp437 vfat fat aes_ce_blk crypto_simd cryptd aes_ce_cipher joydev nicvf cavium_ptp nicpf cavium_rng_vf thunder_bgx thunder_xcv mdio_thunder crct10dif_ce mdio_cavium ghash_ce thunderx_edac sha2_ce cavium_rng sha256_arm64 ipmi_ssif sha1_ce uio_pdrv_genirq ipmi_devintf uio ipmi_msghandler raid0 md_mod btrfs
Apr 25 08:38:12 [37653.060970]  libcrc32c xor xor_neon raid6_pq hid_generic usbhid ast i2c_algo_bit drm_vram_helper drm_ttm_helper ttm drm_kms_helper syscopyarea sysfillrect sysimgblt fb_sys_fops cec rc_core xhci_pci xhci_hcd drm nvme thunderx_mmc usbcore nvme_core gpio_keys mmc_core i2c_thunderx dm_mirror dm_region_hash dm_log sg dm_multipath dm_mod scsi_dh_rdac scsi_dh_emc scsi_dh_alua efivarfs
Apr 25 08:38:12 [37653.238534] CPU: 7 PID: 541 Comm: kworker/7:1H Kdump: loaded Not tainted 5.6.0-rc6-1.g5c2f002-default #1 openSUSE Tumbleweed (unreleased)
Apr 25 08:38:12 [37653.261159] Hardware name: GIGABYTE R120-T32/MT30-GS1, BIOS T19 09/29/2016
Apr 25 08:38:12 [37653.273148] Workqueue: kblockd blk_mq_timeout_work
Apr 25 08:38:12 [37653.282964] pstate: 20000005 (nzCv daif -PAN -UAO)
Apr 25 08:38:12 [37653.292718] pc : nvme_timeout+0x48/0x4e8 [nvme]
Apr 25 08:38:12 [37653.302132] lr : blk_mq_check_expired+0x200/0x220
Apr 25 08:38:12 [37653.311647] sp : ffff800013fd3bd0
Apr 25 08:38:12 [37653.319686] x29: ffff800013fd3bd0 x28: 000000000000000b
Apr 25 08:38:12 [37653.329661] x27: ffff003fcd161200 x26: ffff003fcd161210
Apr 25 08:38:12 [37653.339558] x25: ffff003e7d9e4aa0 x24: ffff003f975b8600
Apr 25 08:38:12 [37653.349368] x23: 0000000000000000 x22: ffff003e7d9e4980
Apr 25 08:38:12 [37653.359097] x21: ffff003e46141ec0 x20: ffff003f87fe9000
Apr 25 08:38:12 [37653.368760] x19: ffff800012e0201c x18: 0000000000000000
Apr 25 08:38:12 [37653.378335] x17: 0000000000000000 x16: 0000000000000000
Apr 25 08:38:12 [37653.388458] x15: 0000000000000000 x14: 0000000000000000
Apr 25 08:38:12 [37653.397852] x13: 0000000000000001 x12: ffff80003fde7800
Apr 25 08:38:12 [37653.407151] x11: 0000000000000075 x10: 0000000000001a90
Apr 25 08:38:12 [37653.416769] xx5 : ffff8000105b1200 x4 : 0000000000000001
Apr 25 08:38:12 [37653.445029] x3 : 0000000000000001 x2 : ffff800008e7ed58
Apr 25 08:38:12 [37653.453947] x1 : 0000000000000000 x0 : ffff003e7d9e4980
Apr 25 08:38:12 [37653.462771] Call trace:
Apr 25 08:38:12 [37653.468646]  nvme_timeout+0x48/0x4e8 [nvme]
Apr 25 08:38:12 [37653.476187]  blk_mq_check_expired+0x200/0x220
Apr 25 08:38:12 [37653.483841]  bt_iter+0x58/0x68
Apr 25 08:38:12 [37653.490098]  blk_mq_queue_tag_busy_iter+0x1b4/0x300
Apr 25 08:38:12 [37653.498125]  blk_mq_timeout_work+0x70/0x150
Apr 25 08:38:12 [37653.505365]  process_one_work+0x1d4/0x478
Apr 25 08:38:12 [37653.512352]  worker_thread+0x150/0x518
Apr 25 08:38:12 [37653.519011]  kthread+0xec/0x118
Apr 25 08:38:12 [37653.524961]  ret_from_fork+0x10/0x18
Apr 25 08:38:12 [37653.531275] Code: d2800001 f9400314 f940ca93 91007273 (b9400273)
Apr 25 08:38:12 [37653.540092] SMP: stopping secondary CPUs
As I have not found events reproducing the same stack traces I do not think a bug report will be helpful.
Overall, as we can not prevent hard crashes with just 4 instances I will bump up the numbers again for openqaworker-arm-1 and openqaworker-arm-3 :
https://gitlab.suse.de/openqa/salt-pillars-openqa/-/merge_requests/241
Updated by SLindoMansilla over 4 years ago
- Blocks action #60833: [qe-core][sle][functional] performance issue of aarch64 worker: Stall detected added
Updated by okurz over 4 years ago
Proposing to save some wait time for the automatic recovery jobs: https://gitlab.suse.de/openqa/salt-states-openqa/-/merge_requests/304
Updated by okurz over 4 years ago
reminder: we have sol sessions active for all arm workers in a screen session on osd and we have an automatic recovery that should detect if workers are down and reset them. if there is a problem then we should fix that. https://stats.openqa-monitor.qa.suse.de/d/1bNU0StZz/automatic-actions?orgId=1 shows that all arm1 and arm2 are down since yesterday early morning, arm3 since yesterday evening. I am checking why the automatic recovery could not help.
arm1 does not show anything after "May 21 02:39:23", arm2 does not have any log entry after May 15, from arm3:
May 21 15:15:35 [759141.661599] SError Interrupt on CPU63, code 0xbe000000 -- SError
May 21 15:15:35 [759141.661602] CPU: 63 PID: 11667 Comm: /usr/bin/isotov Tainted: G        W        4.12.14-lp151.28.48-default #1 openSUSE Leap 15.1
May 21 15:15:35 [759141.661604] Hardware name: GIGABYTE R270-T64-00/MT60-SC4-00, BIOS T32 03/03/2017
May 21 15:15:35 [759141.661605] task: ffff80045e094180 task.stack: ffff80017c564000
May 21 15:15:35 [759141.661606] pstate: 60000005 (nZCv daif -PAN -UAO)
May 21 15:15:35 [759141.661607] pc : ptep_set_access_flags+0xc0/0x100
May 21 15:15:35 [759141.661608] lr : 0xe0000d5cf55bd3
May 21 15:15:35 [759141.661609] sp : ffff80017c567ca0
May 21 15:15:35 [759141.661611] x29: ffff80017c567ca0 x28: ffff80045e094180
May 21 15:15:35 [759141.661614] x27: ffff80017949c468 x26: 0000000000000007
May 21 15:15:35 [759141.661617] x25: ffff810f6ff5f000 x24: 0000000000000054
May 21 15:15:35 [759141.661619] x23: ffff80017949c400 x22: ffff810f6ff5f000
May 21 15:15:35 [759141.661621] x21: 8d5e000aaaae63f2 x20: 00e0000d5cf55fd3
May 21 15:15:35 [759141.661623] x19: ffff8106274c9f90 x18: 0000000000000110
May 21 15:15:35 [759141.661626] x17: 0000ffff899bfc30 x16: 0000aaaac96164c8
May 21 15:15:35 [759141.661628] x15: 000000000000002b x14: 0000000000000000
May 21 15:15:35 [759141.661630] x13: ffffffff00000000 x12: 0000000000000000
May 21 15:15:35 [759141.661633] x11: 000000000000000c x10: 0000000057f65f3f
May 21 15:15:35 [759141.661635] x9 : 0000000000000005 x8 : 0000aaaae51ada80
May 21 15:15:35 [759141.661637] x7 : 0000000000000008 x6 : 0000000000000008
May 21 15:15:35 [759141.661640] x5 : 00e0000d5cf55b53 x4 : 00e0000d5cf55b53
May 21 15:15:35 [759141.661642] x3 : 0080000000000400 x2 : 00e0000d5cf55fd3
May 21 15:15:35 [759141.661644] x1 : 00e0000d5cf55bd3 x0 : 0000000000448d5e
May 21 15:15:35 [759141.661647] Kernel panic - not syncing: Asynchronous SError Interrupt
May 21 15:15:35 [759141.661649] CPU: 63 PID: 11667 Comm: /usr/bin/isotov Tainted: G        W        4.12.14-lp151.28.48-default #1 openSUSE Leap 15.1
May 21 15:15:35 [759141.661650] Hardware name: GIGABYTE R270-T64-00/MT60-SC4-00, BIOS T32 03/03/2017
May 21 15:15:35 [759141.661651] Call trace:
May 21 15:15:35 [759141.661652]  dump_backtrace+0x0/0x188
May 21 15:15:35 [759141.661653]  show_stack+0x24/0x30
May 21 15:15:35 [759141.661654]  dump_stack+0x90/0xb0
May 21 15:15:35 [759141.661655]  panic+0x114/0x28c
May 21 15:15:35 [759141.661655]  nmi_panic+0x7c/0x80
May 21 15:15:35 [759141.661656]  arm64_serror_panic+0x80/0x90
May 21 15:15:35 [759141.661657]  __pte_error+0x0/0x50
May 21 15:15:35 [759141.661658]  el1_error+0x7c/0xdc
May 21 15:15:35 [759141.661659]  ptep_set_access_flags+0xc0/0x100
May 21 15:15:35 [759141.661660]  __handle_mm_fault+0x204/0x500
May 21 15:15:35 [759141.661661]  handle_mm_fault+0xd4/0x178
May 21 15:15:35 [759141.661662]  do_page_fault+0x1a0/0x448
May 21 15:15:35 [759141.661663]  do_mem_abort+0x54/0xb0
May 21 15:15:35 [759141.661664]  el0_da+0x24/0x28
May 21 15:15:35 [759142.745040] SError Interrupt on CPU2, code 0xbe000000 -- SError
all three arm machines are back now and currently refreshing their asset and test cache.
Created https://gitlab.suse.de/openqa/salt-states-openqa/-/merge_requests/306 to bump detection interval from 3m to 15m again. Maybe this was a problem.
EDIT: 2020-05-25: See https://chat.suse.de/channel/testing?msg=AcrJd7KzfFPz2qf92 openqaworker-arm-2 and openqaworker-arm-3 are down again. I checked why the automatic recovery did not work anymore. I tried to send a test event following https://stats.openqa-monitor.qa.suse.de/alerting/notifications for arm3 and that failed. I had the suspicion that the automatic reboots of arm can not be triggered anymore due to changed authentication after the move to the new authentication server. I triggered manual power cycle for both machines now. Then I created new tokens on https://gitlab.suse.de/openqa/grafana-webhook-actions/-/settings/ci_cd#js-pipeline-triggers and put them into the grafana actions. Then sending test events worked again. Also reproduced the problem and the fix manually using curl.
Updated by okurz over 4 years ago
Again arm workers were down for multiple days and not recovered. However also sending test events works following https://stats.openqa-monitor.qa.suse.de/alerting/notification/5/edit and also I can see the gitlab CI pipeline triggered on https://gitlab.suse.de/openqa/grafana-webhook-actions/pipelines/66242
Checking the IPMI logs that are still recorded in a screen session on osd I can see that the kernel bugs with stacktrace as mentioned in #41882#note-46 are reproduced, e.g. on openqaworker-arm-3:
Jun 08 12:31:59 [318755.816384] SError Interrupt on CPU35, code 0xbe000000 -- SError
Jun 08 12:31:59 [318755.816387] CPU: 35 PID: 46766 Comm: /usr/bin/isotov Tainted: G        W        4.12.14-lp151.28.48-default #1 openSUSE Leap 15.1
Jun 08 12:31:59 [318755.816388] Hardware name: GIGABYTE R270-T64-00/MT60-SC4-00, BIOS T32 03/03/2017
Jun 08 12:31:59 [318755.816390] task: ffff8008dd9f0000 task.stack: ffff80067f058000
Jun 08 12:31:59 [318755.816391] pstate: 60000005 (nZCv daif -PAN -UAO)
Jun 08 12:31:59 [318755.816392] pc : ptep_set_access_flags+0xc0/0x100
Jun 08 12:31:59 [318755.816393] lr : 0xe0000d6c14dbd3
Jun 08 12:31:59 [318755.816394] sp : ffff80067f05bca0
Jun 08 12:31:59 [318755.816395] x29: ffff80067f05bca0 x28: ffff8008dd9f0000
Jun 08 12:31:59 [318755.816398] x27: ffff810f73eee068 x26: 0000000000000007
Jun 08 12:31:59 [318755.816401] x25: ffff8005a231a000 x24: 0000000000000054
Jun 08 12:31:59 [318755.816403] x23: ffff810f73eee000 x22: ffff8005a231a000
Jun 08 12:31:59 [318755.816405] x21: 23b2000aaab12947 x20: 00e0000d6c14dfd3
Jun 08 12:31:59 [318755.816408] x19: ffff80080c278a38 x18: 0000000000000000
Jun 08 12:31:59 [318755.816410] x17: 0000ffff9e9ffc30 x16: 0000aaaae61764c8
Jun 08 12:31:59 [318755.816413] x15: 00009e03cd2ea718 x14: ffffffffffffffe8
Jun 08 12:31:59 [318755.816415] x13: ffffffff00000000 x12: 0000000000000000
Jun 08 12:31:59 [318755.816417] x11: 0000aaab1294ebc0 x10: 00000000cc31f27a
Jun 08 12:31:59 [318755.816420] x9 : 003b9aca00000000 x8 : 0000aaab0f6f24e0
Jun 08 12:31:59 [318755.816422] x7 : 000000002010000c x6 : 0000aaab0d328398
Jun 08 12:31:59 [318755.816424] x5 : 00e0000d6c14db53 x4 : 00e0000d6c14db53
Jun 08 12:31:59 [318755.816427] x3 : 0080000000000400 x2 : 00e0000d6c14dfd3
Jun 08 12:31:59 [318755.816429] x1 : 00e0000d6c14dbd3 x0 : 00000000001323b2
Jun 08 12:31:59 [318755.816432] Kernel panic - not syncing: Asynchronous SError Interrupt
Jun 08 12:31:59 [318755.816434] CPU: 35 PID: 46766 Comm: /usr/bin/isotov Tainted: G        W        4.12.14-lp151.28.48-default #1 openSUSE Leap 15.1
Jun 08 12:31:59 [318755.816436] Hardware name: GIGABYTE R270-T64-00/MT60-SC4-00, BIOS T32 03/03/2017
Jun 08 12:31:59 [318755.816437] Call trace:
Jun 08 12:31:59 [318755.816438]  dump_backtrace+0x0/0x188
Jun 08 12:31:59 [318755.816439]  show_stack+0x24/0x30
Jun 08 12:31:59 [318755.816440]  dump_stack+0x90/0xb0
Jun 08 12:31:59 [318755.816440]  panic+0x114/0x28c
Jun 08 12:31:59 [318755.816442]  nmi_panic+0x7c/0x80
Jun 08 12:31:59 [318755.816442]  arm64_serror_panic+0x80/0x90
Jun 08 12:31:59 [318755.816443]  __pte_error+0x0/0x50
Jun 08 12:31:59 [318755.816444]  el1_error+0x7c/0xdc
Jun 08 12:31:59 [318755.816445]  ptep_set_access_flags+0xc0/0x100
Jun 08 12:31:59 [318755.816446]  __handle_mm_fault+0x204/0x500
Jun 08 12:31:59 [318755.816448]  handle_mm_fault+0xd4/0x178
Jun 08 12:31:59 [318755.816448]  do_page_fault+0x1a0/0x448
Jun 08 12:31:59 [318755.816449]  do_mem_abort+0x54/0xb0
Jun 08 12:31:59 [318755.816450]  el0_da+0x24/0x28
Jun 08 12:31:59 [318756.899864] SMP: stopping secondary CPUs
Jun 08 12:31:59 [318756.899865] SMP: failed to stop secondary CPUs 35,44,49,53,69,83,93
Jun 08 12:31:59 [318756.899866] Kernel Offset: disabled
Jun 08 12:31:59 [318756.899867] CPU features: 0x01,04101128
Jun 08 12:31:59 [318756.899868] Memory Limit: none
Jun 08 12:31:59 [318756.899884] SError Interrupt on CPU83, code 0xbe000000 -- SError
Jun 08 12:31:59 [318756.899886] CPU: 83 PID: 68368 Comm: qemu-system-aar Tainted: G        W        4.12.14-lp151.28.48-default #1 openSUSE Leap 15.1
Jun 08 12:31:59 [318756.899888] Hardware name: GIGABYTE R270-T64-00/MT60-SC4-00, BIOS T32 03/03/2017
Jun 08 12:31:59 [318756.899889] task: ffff8007adffa000 task.stack: ffff8005ea864000
Jun 08 12:31:59 [318756.899890] pstate: 60000005 (nZCv daif -PAN -UAO)
Jun 08 12:31:59 [318756.899891] pc : unmap_page_range+0x214/0x7b8
Jun 08 12:31:59 [318756.899892] lr : unmap_page_range+0x190/0x7b8
Jun 08 12:31:59 [318756.899893] sp : ffff8005ea867bc0
Jun 08 12:31:59 [318756.899894] x29: ffff8005ea867bc0 x28: 0000ffff115d6000
Jun 08 12:31:59 [318756.899897] x27: ffff8005ea867d68 x26: 0400000000000001
Jun 08 12:31:59 [318756.899899] x25: 0000ffff115d6000 x24: ffff8007d4580eb0
Jun 08 12:31:59 [318756.899901] x23: 0000ffff115d6000 x22: ffff8005ea867c90
Jun 08 12:31:59 [318756.899904] x21: 0000ffff115d6000 x20: ffff8005ea867d68
Jun 08 12:31:59 [318756.899906] x19: 0000ffff115d6000 x18: 0000000000000090
Jun 08 12:31:59 [318756.899909] x17: 0000ffff889bf3d0 x16: ffff000008285340
Jun 08 12:31:59 [318756.899911] x15: 000099d9c671095f x14: 0024612e20dea652
Jun 08 12:31:59 [318756.899914] x13: 000000005ede139c x12: 0000000000000018
Jun 08 12:31:59 [318756.899916] x11: 000000000ebaa97e x10: 000000000004dd30
Jun 08 12:31:59 [318756.899919] x9 : 003b9aca00000000 x8 : 00000000000000d7
Jun 08 12:31:59 [318756.899921] x7 : 0000000000000001 x6 : ffff810f7056e6b0
Jun 08 12:31:59 [318756.899924] 57.348544] ---[ end Kernel panic - not syncing: Asynchronous SError Interrupt
Then the system was recovered in https://gitlab.suse.de/openqa/grafana-webhook-actions/-/jobs/215721#L3 at 12:47 and rebooted until
Jun 08 12:53:31 Welcome to openSUSE Leap 15.1 - Kernel 4.12.14-lp151.28.48-default (ttyAMA0).
then again a new event shortly afterwards
Jun 08 14:38:27 [ 6436.241644] SError Interrupt on CPU8, code 0xbe000000 -- SError
Jun 08 14:38:27 [ 6436.241647] CPU: 8 PID: 58085 Comm: /usr/bin/isotov Tainted: G        W        4.12.14-lp151.28.48-default #1 openSUSE Leap 15.1
Jun 08 14:38:27 [ 6436.241649] Hardware name: GIGABYTE R270-T64-00/MT60-SC4-00, BIOS T32 03/03/2017
Jun 08 14:38:27 [ 6436.241651] task: ffff810c9101c080 task.stack: ffff810c9e640000
Jun 08 14:38:27 [ 6436.241652] pstate: 20000005 (nzCv daif -PAN -UAO)
Jun 08 14:38:27 [ 6436.241653] pc : unmap_page_range+0x214/0x7b8
Jun 08 14:38:27 [ 6436.241654] lr : unmap_page_range+0x190/0x7b8
Jun 08 14:38:27 [ 6436.241655] sp : ffff810c9e643be0
Jun 08 14:38:27 [ 6436.241656] x29: ffff810c9e643be0 x28: 0000aaaad74b7000
Jun 08 14:38:27 [ 6436.241659] x27: ffff810c9e643d88 x26: 0400000000000001
Jun 08 14:38:27 [ 6436.241662] x25: 0000aaaad74b7000 x24: ffff810c91e385b8
Jun 08 14:38:27 [ 6436.241664] x23: 0000aaaad74b7000 x22: ffff810c9e643cb0
Jun 08 14:38:27 [ 6436.241666] x21: 0000aaaad74b7000 x20: ffff810c9e643d88
Jun 08 14:38:27 [ 6436.241669] x19: 0000aaaad74b7000 x18: 0000ffffdca65bd0
Jun 08 14:38:27 [ 6436.241671] x17: 0000ffff931c0c30 x16: ffff0000082861c8
Jun 08 14:38:27 [ 6436.241673] x15: 00000000000003c0 x14: 0000000000000000
Jun 08 14:38:27 [ 6436.241676] x13: 0000000000000000 x12: ffffffffffffff83
Jun 08 14:38:27 [ 6436.241678] x11: 0000000000000000 x10: ffff810fffeb12c0
Jun 08 14:38:27 [ 6436.241681] x9 : 000000000000000a x8 : 0000000000000001
Jun 08 14:38:27 [ 6436.241683] x7 : 0000000000000010 x6 : ffff810e9d836eb0
Jun 08 14:38:27 [ 6436.241686] x5 : 0000000000000000 x4 : ffff810e9d836ec8
Jun 08 14:38:27 [ 6436.241688] x3 : 0000000000be7000 x2 : 0000aaaad7497000
Jun 08 14:38:27 [ 6436.241690] x1 : b568000000000000 x0 : 0000aaaad68b0000
Jun 08 14:38:27 [ 6436.241693] Kernel panic - not syncing: Asynchronous SError Interrupt
Jun 08 14:38:27 [ 6436.241695] CPU: 8 PID: 58085 Comm: /usr/bin/isotov Tainted: G        W        4.12.14-lp151.28.48-default #1 openSUSE Leap 15.1
Jun 08 14:38:27 [ 6436.241697] Hardware name: GIGABYTE R270-T64-00/MT60-SC4-00, BIOS T32 03/03/2017
Jun 08 14:38:27 [ 6436.241698] Call trace:
Jun 08 14:38:27 [ 6436.241699]  dump_backtrace+0x0/0x188
…
which was detected in grafana but no event shows up in grafana! Maybe because the previous pipeline was still running at this time? I triggered three pipeline shortly after each other with a curl call same as used by grafana and all three were running in parallel with each sending the correct IPMI power cycle command.
if any of you know how to have a 2nd-level alert in grafana that would help. Currently it's like this: We have a panel recording the results on "ping" to the machine, if it is offline for a couple of minutes we trigger a special grafana "notification" that is a HTTP POST to gitlab to trigger a pipeline which triggers a power cycle and ensures that the machine is up. If the latter fails to bring up the machine we never receive an alert again. So we should have an alert using a generic "send email to mailing list" alert action if the machine is still down after a longer time, let's say 2h
https://github.com/grafana/grafana/issues/7832 shows in a lengthy discussion that the feature to have multiple alerts per panel is much-wanted but nowhere to be seen at all. https://github.com/grafana/grafana/pull/20822#issuecomment-561047900 mentions that the complete alerting implementation in grafana might change a lot or even be non-existant in the current form in the future. Alternative to consider is prometheus, workaround is to have one panel per alert.
Created https://gitlab.suse.de/openqa/salt-states-openqa/-/merge_requests/309 to have 2nd-level alerts. Merged.
Updated by okurz over 4 years ago
I reported https://bugzilla.opensuse.org/show_bug.cgi?id=1172997 regarding the kernel panic about "SError Interrupt on CPU…". As of know looking at the data in grafana I can not yet say if kernel 5.6 is more stable than 4.12 so I will keep openqaworker-arm-3 at 4.12 for comparison.
EDIT: 2020-06-22: Discussed with mbrugger. He suggests Kernel:stable over KOTD but previously I have been asked to use KOTD to check reproducibility in master. However our kernel packages on openqaworker-arm-1 and openqaworker-arm-2 that originally installed KOTD were still running 5.6 so outdated. I now manually enabled Kernel:stable for both and systems are booting into the new version:
sudo salt -l error -C 'G@roles:worker and G@osarch:aarch64 and openqaworker-arm-[12]*' cmd.run 'zypper mr -d -r KOTD; zypper lr; zypper ar -f -p 95 http://download.opensuse.org/repositories/Kernel:/stable/ARM/Kernel:stable.repo; zypper -n in kernel-default'
sudo salt -l error -C 'G@roles:worker and G@osarch:aarch64 and openqaworker-arm-[1*' cmd.run 'reboot'
mbrugger is looking into bugzilla.suse.com/1172997 and checks with a development machine for reference and might be able to help further.
Updated by okurz over 4 years ago
- Due date deleted (
2020-06-30)
I set a due date in #41882#note-33 to check on the progress on https://bugzilla.opensuse.org/show_bug.cgi?id=1165642 . There has been no response for more than 3 months now, I give up. In the meantime there is also https://bugzilla.opensuse.org/show_bug.cgi?id=1172997 and mbrugger is the assignee and discussed with me. Last time we talked he was looking for an environment to crosscheck in.
Updated by okurz over 4 years ago
- Status changed from Feedback to Resolved
Enough bugs have been reported and are still open. I would react on questions in there if there are any. Also we have good automatic recovery so we can live with the current state. I do not think we need this ticket to be kept open. It will still be a helpful reference though.
Updated by okurz 7 months ago
- Related to action #159270: openqaworker-arm-1 is Unreachable size:S added