action #127052
closed[alert] Apache Response Time alert followed by DatasourceNoData for min_apache_response size:M
0%
Description
Observation
#### Apache Response Time alert

    alertname: Apache Response Time alert
    grafana_folder: Salt
    rule_uid: zZAh5mf4k

Value: A=963378
Date: 31. 03. 23 23:38
Link: http://stats.openqa-monitor.qa.suse.de/d/WebuiDb?orgId=1&viewPanel=84

#### DatasourceNoData

    alertname: DatasourceNoData
    datasource_uid: 000000001
    grafana_folder: Salt
    ref_id: min_apache_response
    rule_uid: zZAh5mf4k
    rulename: Apache Response Time alert
Date: 31. 03. 23 23:55
Link: http://stats.openqa-monitor.qa.suse.de/d/WebuiDb?orgId=1&viewPanel=84
Acceptance Criteria
- AC1: It is known what the alert means
- AC2: Alerts are not triggering
Suggestions
- Remove the alert if we do not know what we need it for
- Check if and why data points are missing
- Consider a mob session or just get together in jitsi to brainstorm a solution
Rollback steps
- On OSD
salt-key -y -a openqa.suse.de
Files
| response time.png (2.07 MB) response time.png | |||
| response-time.png (1.54 MB) response-time.png | |||
| year-ago.png (1.65 MB) year-ago.png | |||
| first.png (1.67 MB) first.png | |||
| 24hours.png (1.61 MB) 24hours.png | |||
| fail.png (1.61 MB) fail.png |
Updated by okurz almost 2 years ago
- Tags changed from alert to alert, infra
- Priority changed from Normal to Urgent
Updated by mkittler almost 2 years ago
It happened again. I've been adding a silence now.
Updated by mkittler almost 2 years ago
The alert was triggered again and my silence didn't work. I don't know why. It matches the alert exactly and it is really always the same alert.
Updated by mkittler almost 2 years ago
Now using the rule_uid in the silence. Maybe it works better but I doubt it.
Updated by livdywan almost 2 years ago
- Subject changed from [alert] Apache Response Time alert followed by DatasourceNoData for min_apache_response to [alert] Apache Response Time alert followed by DatasourceNoData for min_apache_response size:M
- Description updated (diff)
- Status changed from New to Workable
Updated by nicksinger almost 2 years ago
- Priority changed from Urgent to High
I adjusted the panel to better show periods of missing data over a longer period of time: https://gitlab.suse.de/openqa/salt-states-openqa/-/merge_requests/834
With that merged you can see spots of 1-2h missing in https://stats.openqa-monitor.qa.suse.de/d/WebuiDb/webui-summary?orgId=1&from=now-7d&to=now&viewPanel=84 - a lot of times this happens around midnight but sometimes also in the middle of the day. The silence we added apparently worked this time so I still see this issue as high priority but not urgent anymore.
Updated by okurz almost 2 years ago
- Related to action #127985: [alert][grafana] Handle various problems with slow monitoring https requests and such (was: DatasourceNoData HTTP Response alert) size:M added
Updated by okurz almost 2 years ago
- Related to action #126212: openqa.suse.de response times very slow. No alert fired size:M added
Updated by okurz almost 2 years ago
please be aware about my MR https://gitlab.suse.de/openqa/salt-states-openqa/-/merge_requests/844 to handle NoData gracefully also affecting the alert mentioned here.
Updated by kraih almost 2 years ago
- File response time.png response time.png added
- Status changed from Workable to In Progress
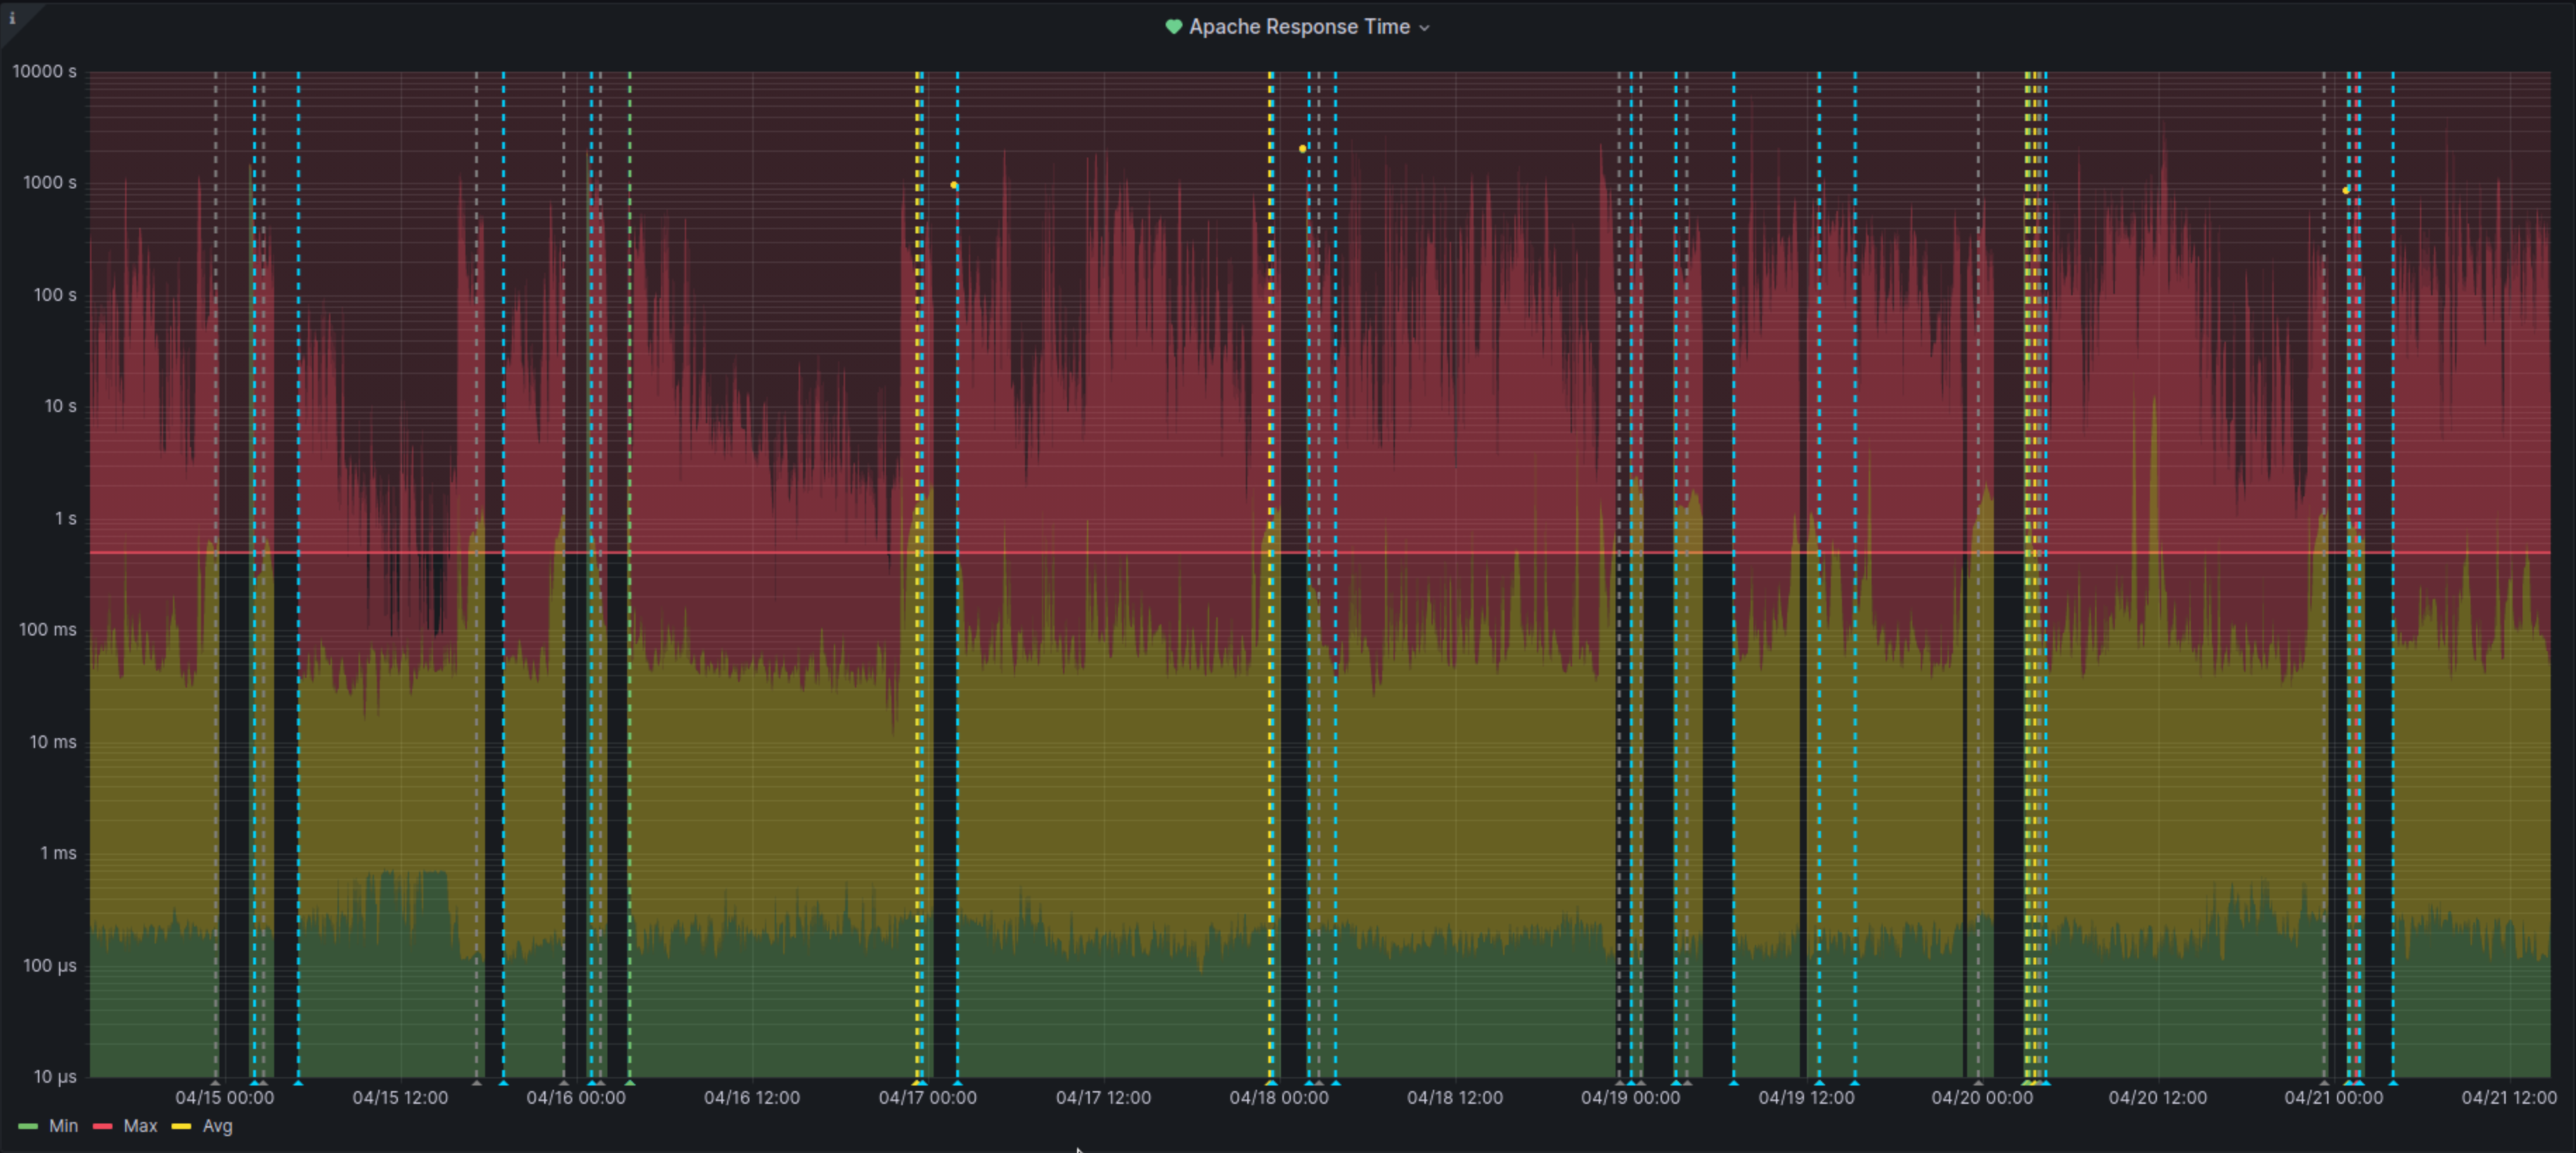
The graph for the last 7 days looks rather suspicious, like something is happening on a schedule when the no data events occur:
21/04 02:05-04:00 (last: 02:07:48)
20/04 23:35-01:05 (last: 23:37:48)
20/04 00:45-03:00 (last: 00:48:24)
19/04 22:45-23:00 (last: 22:42:48)
19/04 11:30-11:50 (last: 11:30:12)
19/04 04:55-07:00 (last: 04:56:36)
19/04 00:55-03:00 (last: 00:55:00)
18/04 22:55-00:00 (last: 22:59:24)
18/04 00:00-02:00 (last: 00:08:00)
17/04 00:25-02:00 (last: 00:27:12)
16/04 02:05-03:25 (last: 02:06:36)
15/04 23:15-01:05 (last: 23:19:00)
15/04 17:45-19:00 (last: 17:49:48)
15/04 03:25-05:00 (last: 03:29:12)
14/04 23:35-02:00 (last: 23:35:36)
Updated by kraih almost 2 years ago
In the data i'm not seeing an obvious connection to #127985, there is very little overlap between the no data events. It appears much more random in the other ticket.
Updated by okurz almost 2 years ago
My idea based on your suggestions: https://github.com/os-autoinst/openQA/pull/5092
EDIT: 2023-04-25: Created https://gitlab.suse.de/openqa/salt-states-openqa/-/merge_requests/849 to use the lightweight "/health" check
Updated by kraih almost 2 years ago
okurz wrote:
My idea based on your suggestions: https://github.com/os-autoinst/openQA/pull/5092
For context, i noticed that our workers are DDoS-ing the OSD webui a little bit by requesting /changelog for monitoring, that PR is a solution:
**IP_ADDRESS1** - - [21/Apr/2023:00:50:00 +0200] "GET /changelog HTTP/1.1" 200 134226 "-" "Go-http-client/1.1" 1639
**IP_ADDRESS2** - - [21/Apr/2023:00:50:00 +0200] "GET /changelog HTTP/1.1" 200 134227 "-" "Go-http-client/1.1" 1784
**IP_ADDRESS3** - - [21/Apr/2023:00:50:00 +0200] "GET /changelog HTTP/1.1" 200 134227 "-" "Go-http-client/1.1" 1913
**IP_ADDRESS4** - - [21/Apr/2023:00:50:00 +0200] "GET /changelog HTTP/1.1" 200 134226 "-" "Go-http-client/1.1" 2010
**IP_ADDRESS5** - - [21/Apr/2023:00:50:00 +0200] "GET /changelog HTTP/1.1" 200 134226 "-" "Go-http-client/1.1" 2010
...
The request frequency seems a bit too low to be the cause for this ticket though, despite the response size. So i'll keep looking for more in the Apache logs.
Updated by openqa_review almost 2 years ago
- Due date set to 2023-05-06
Setting due date based on mean cycle time of SUSE QE Tools
Updated by kraih almost 2 years ago
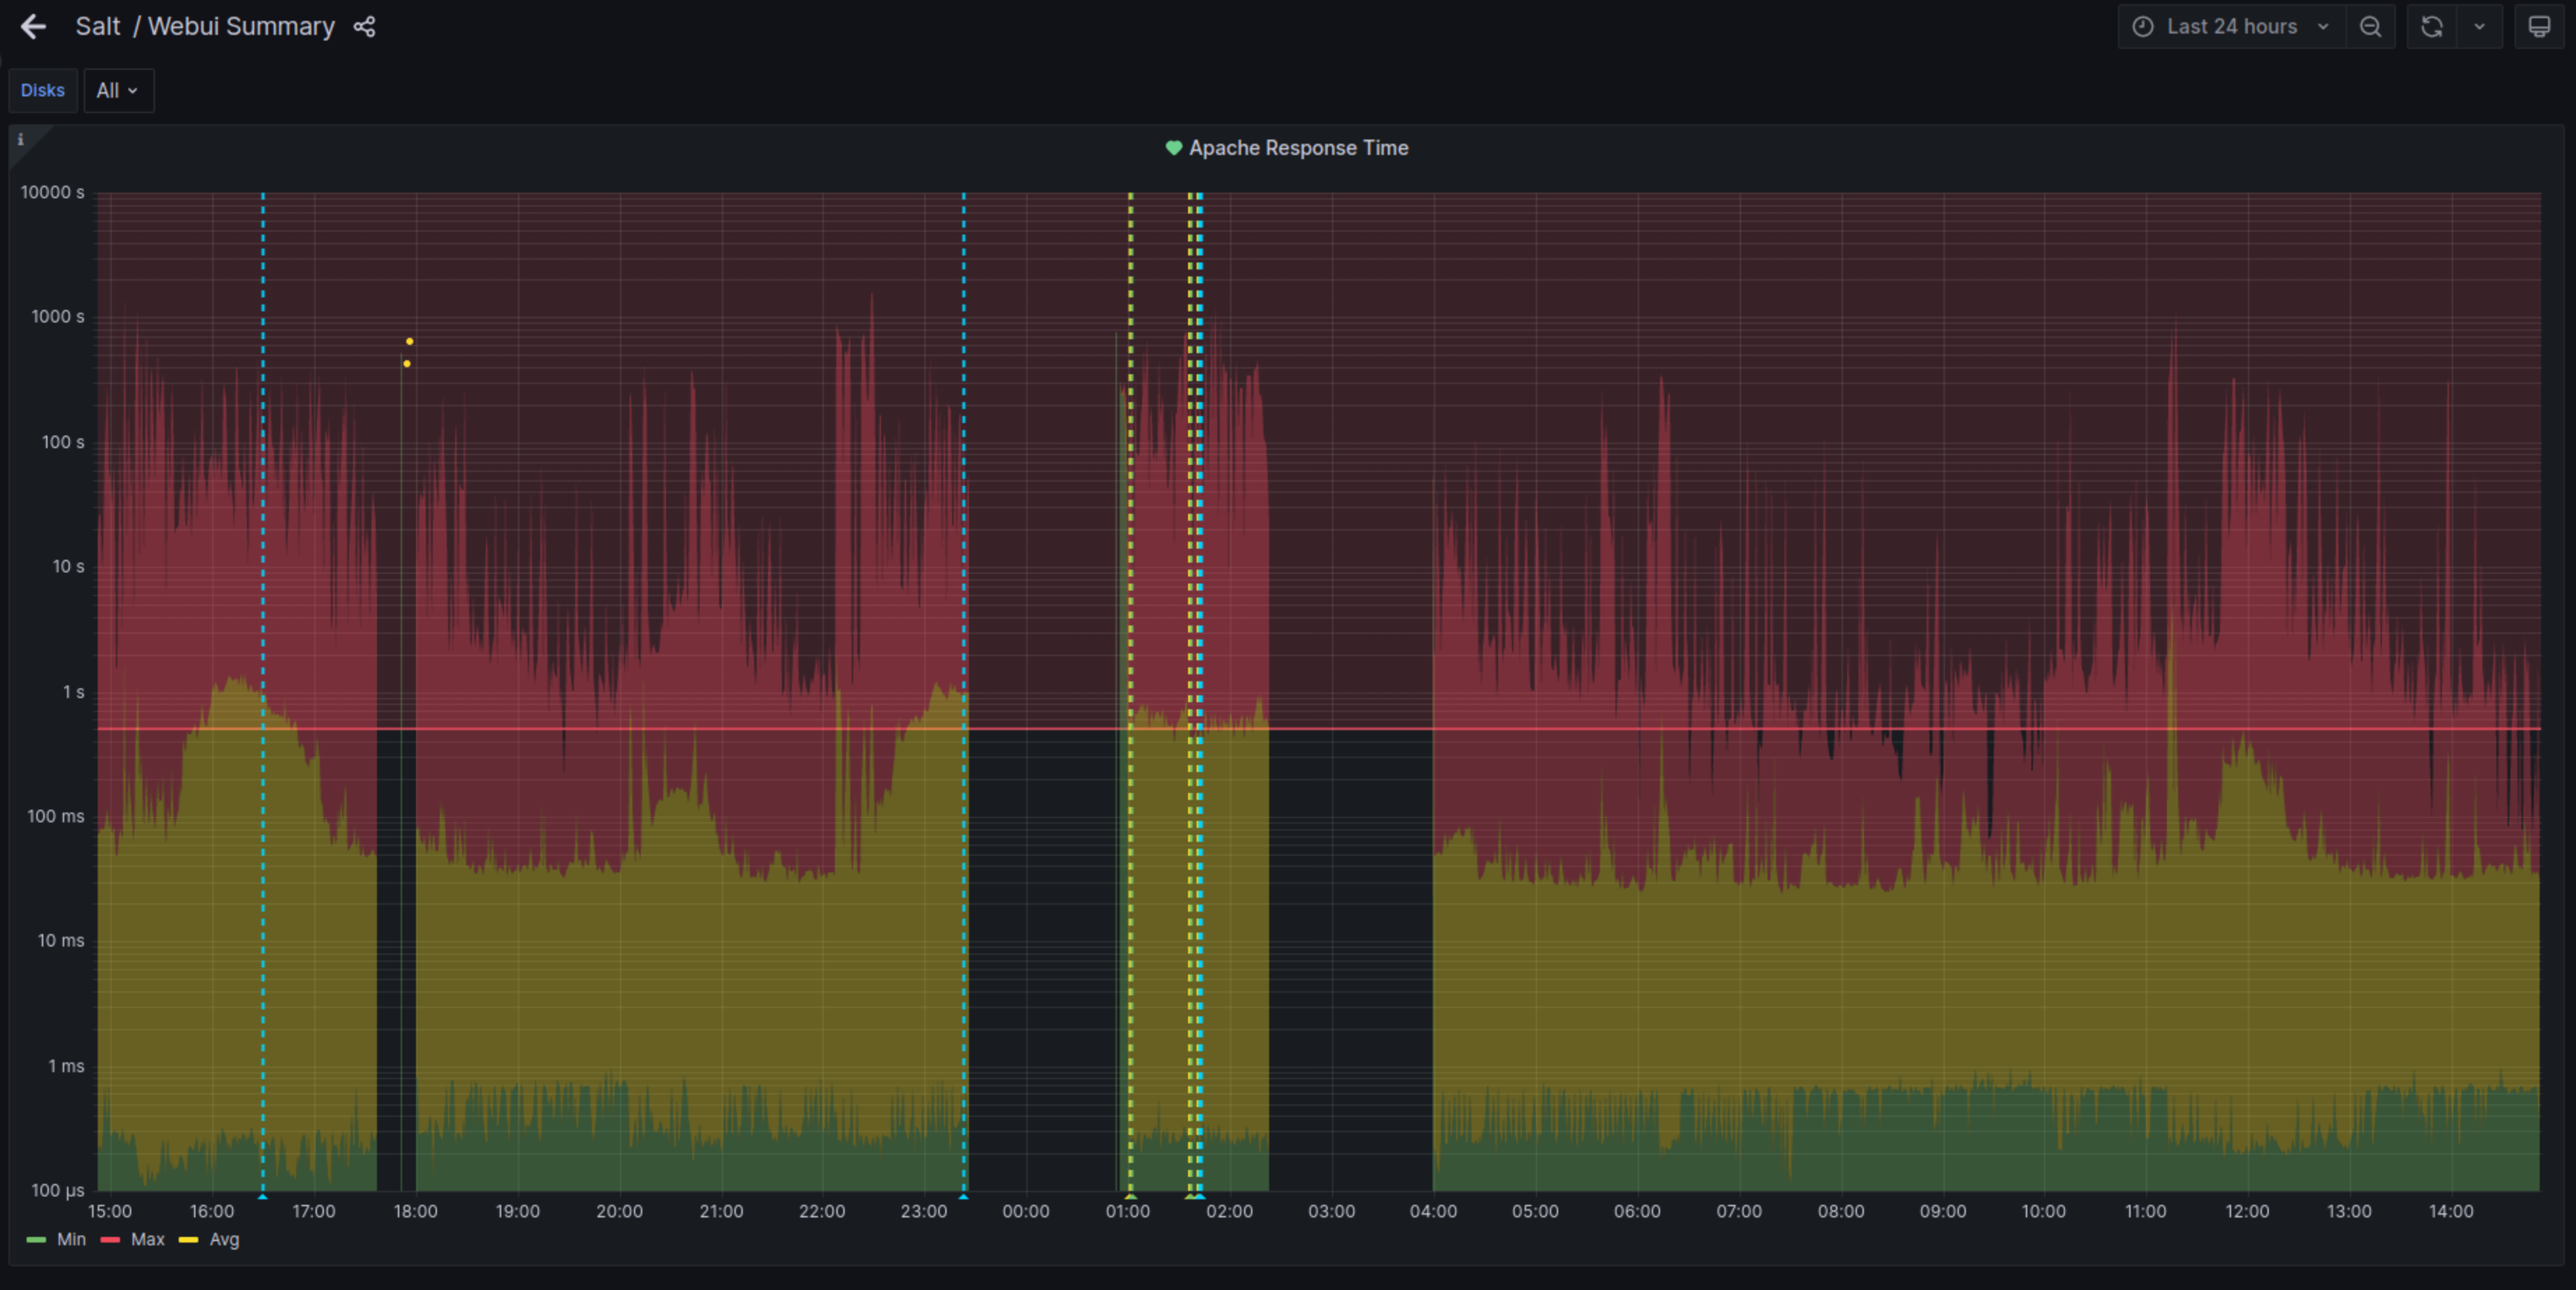
- File response-time.png response-time.png added
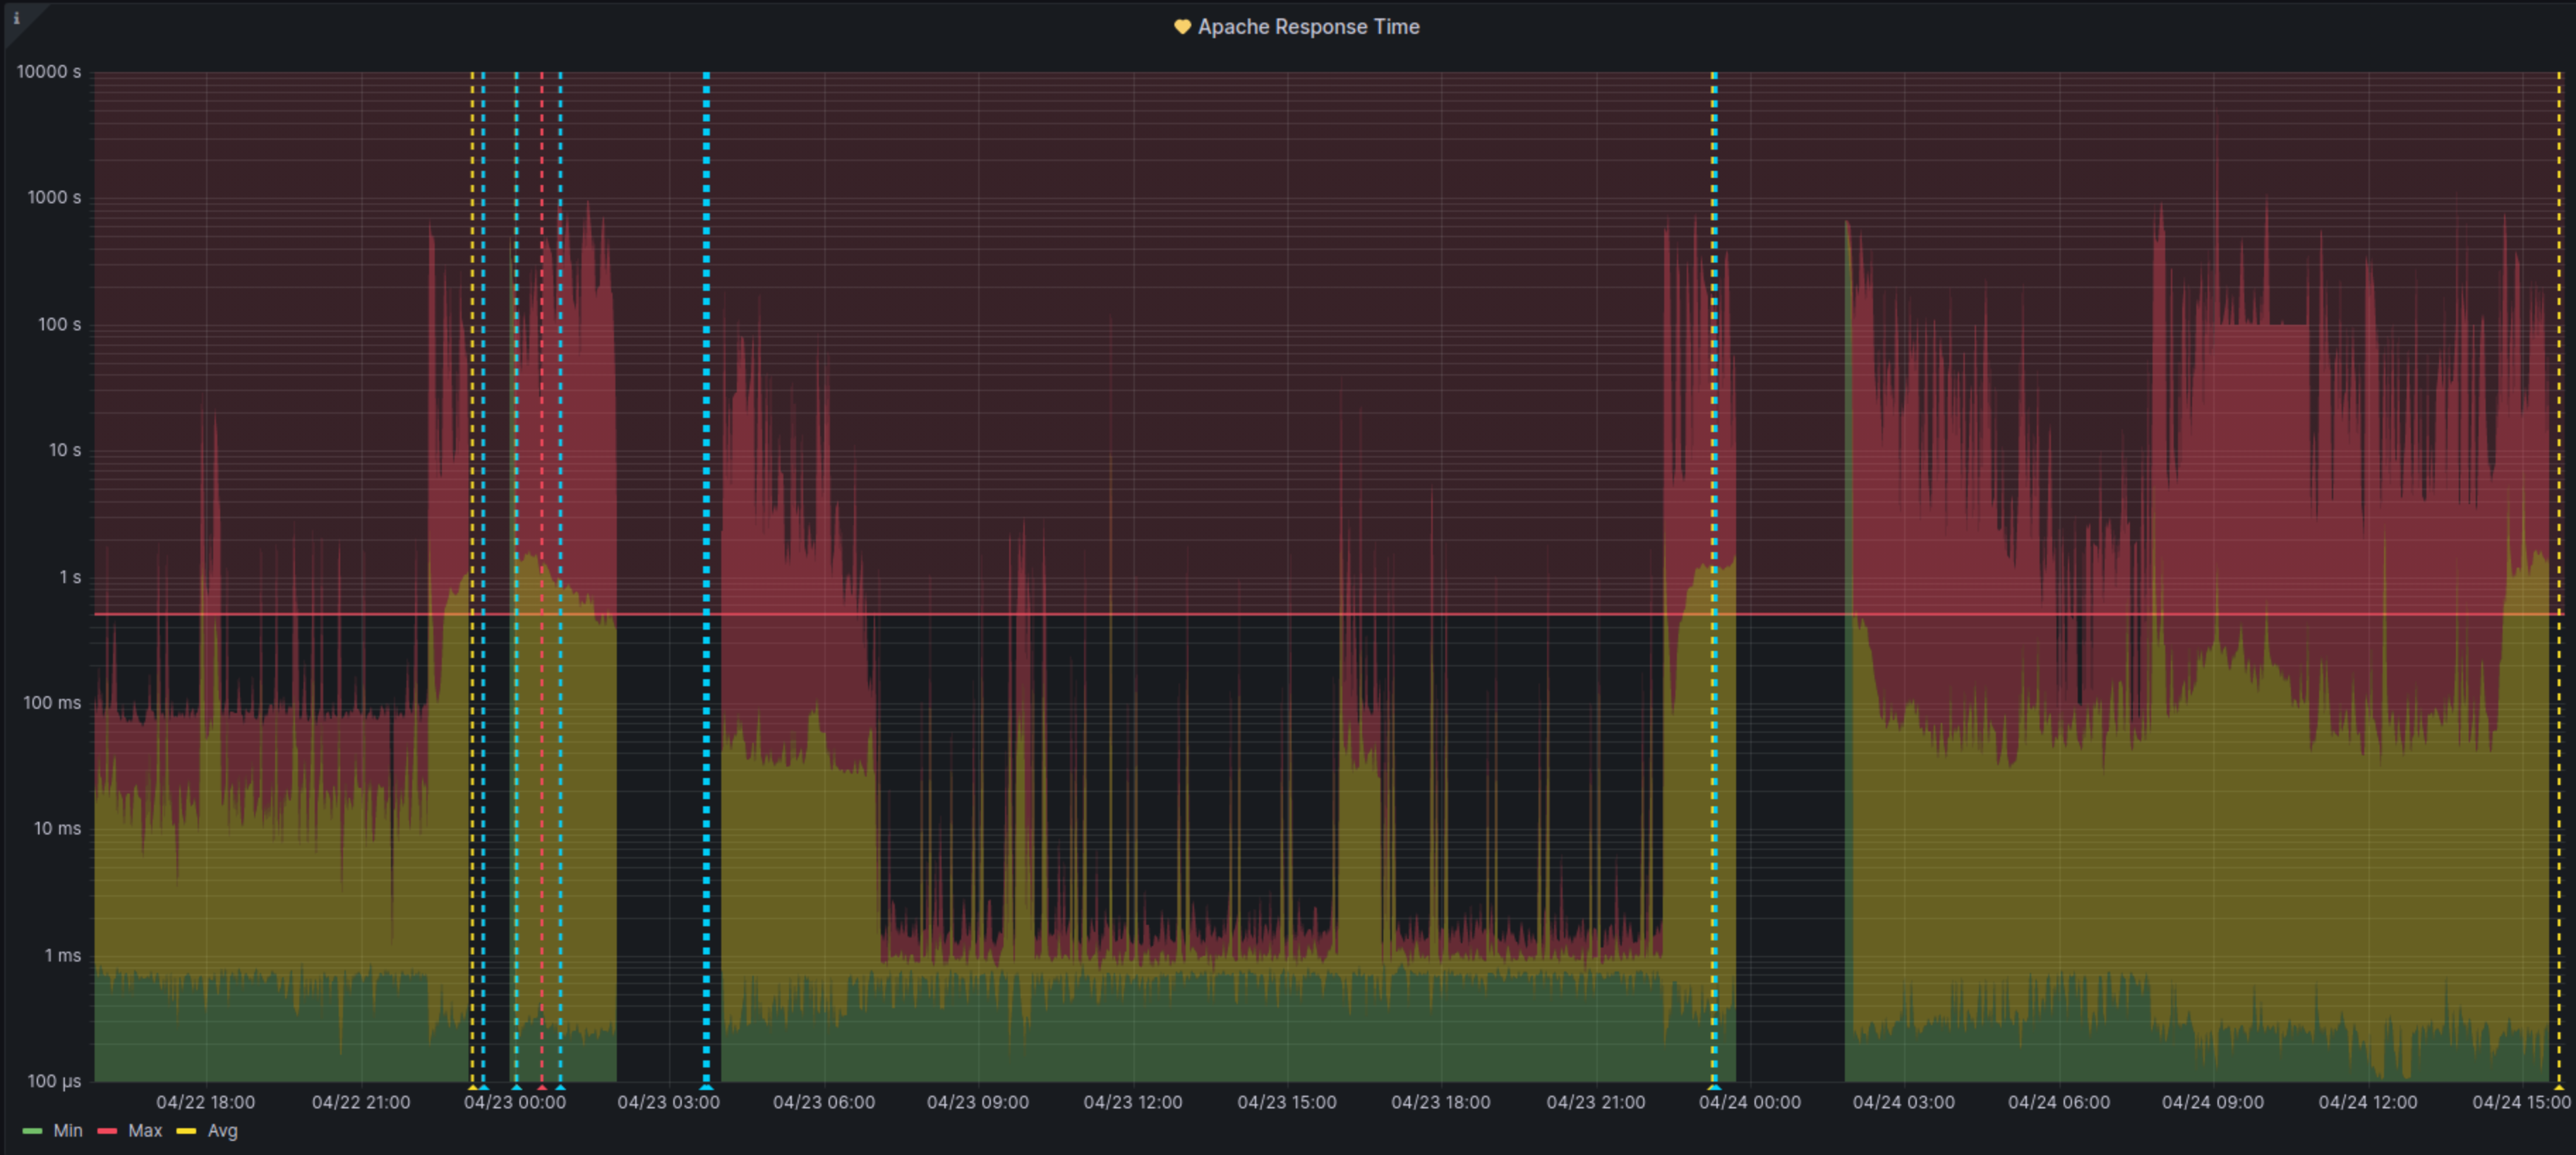
Same pattern again in the last two days.
23/04 23:45:12 - 01:59:48
23/04 01:58:12 - 04:00:00
22/04 23:06:24 - 00:00:12
I've checked the Apache logs for all cases in the past week and i'm not seeing anything particularly suspicious. Everything looks perfectly normal and there's hundreds of normal requests happening, and users interacting with the webui during those timeframes. Which leads me to believe that the problem might not be on the web server side.
Updated by kraih almost 2 years ago
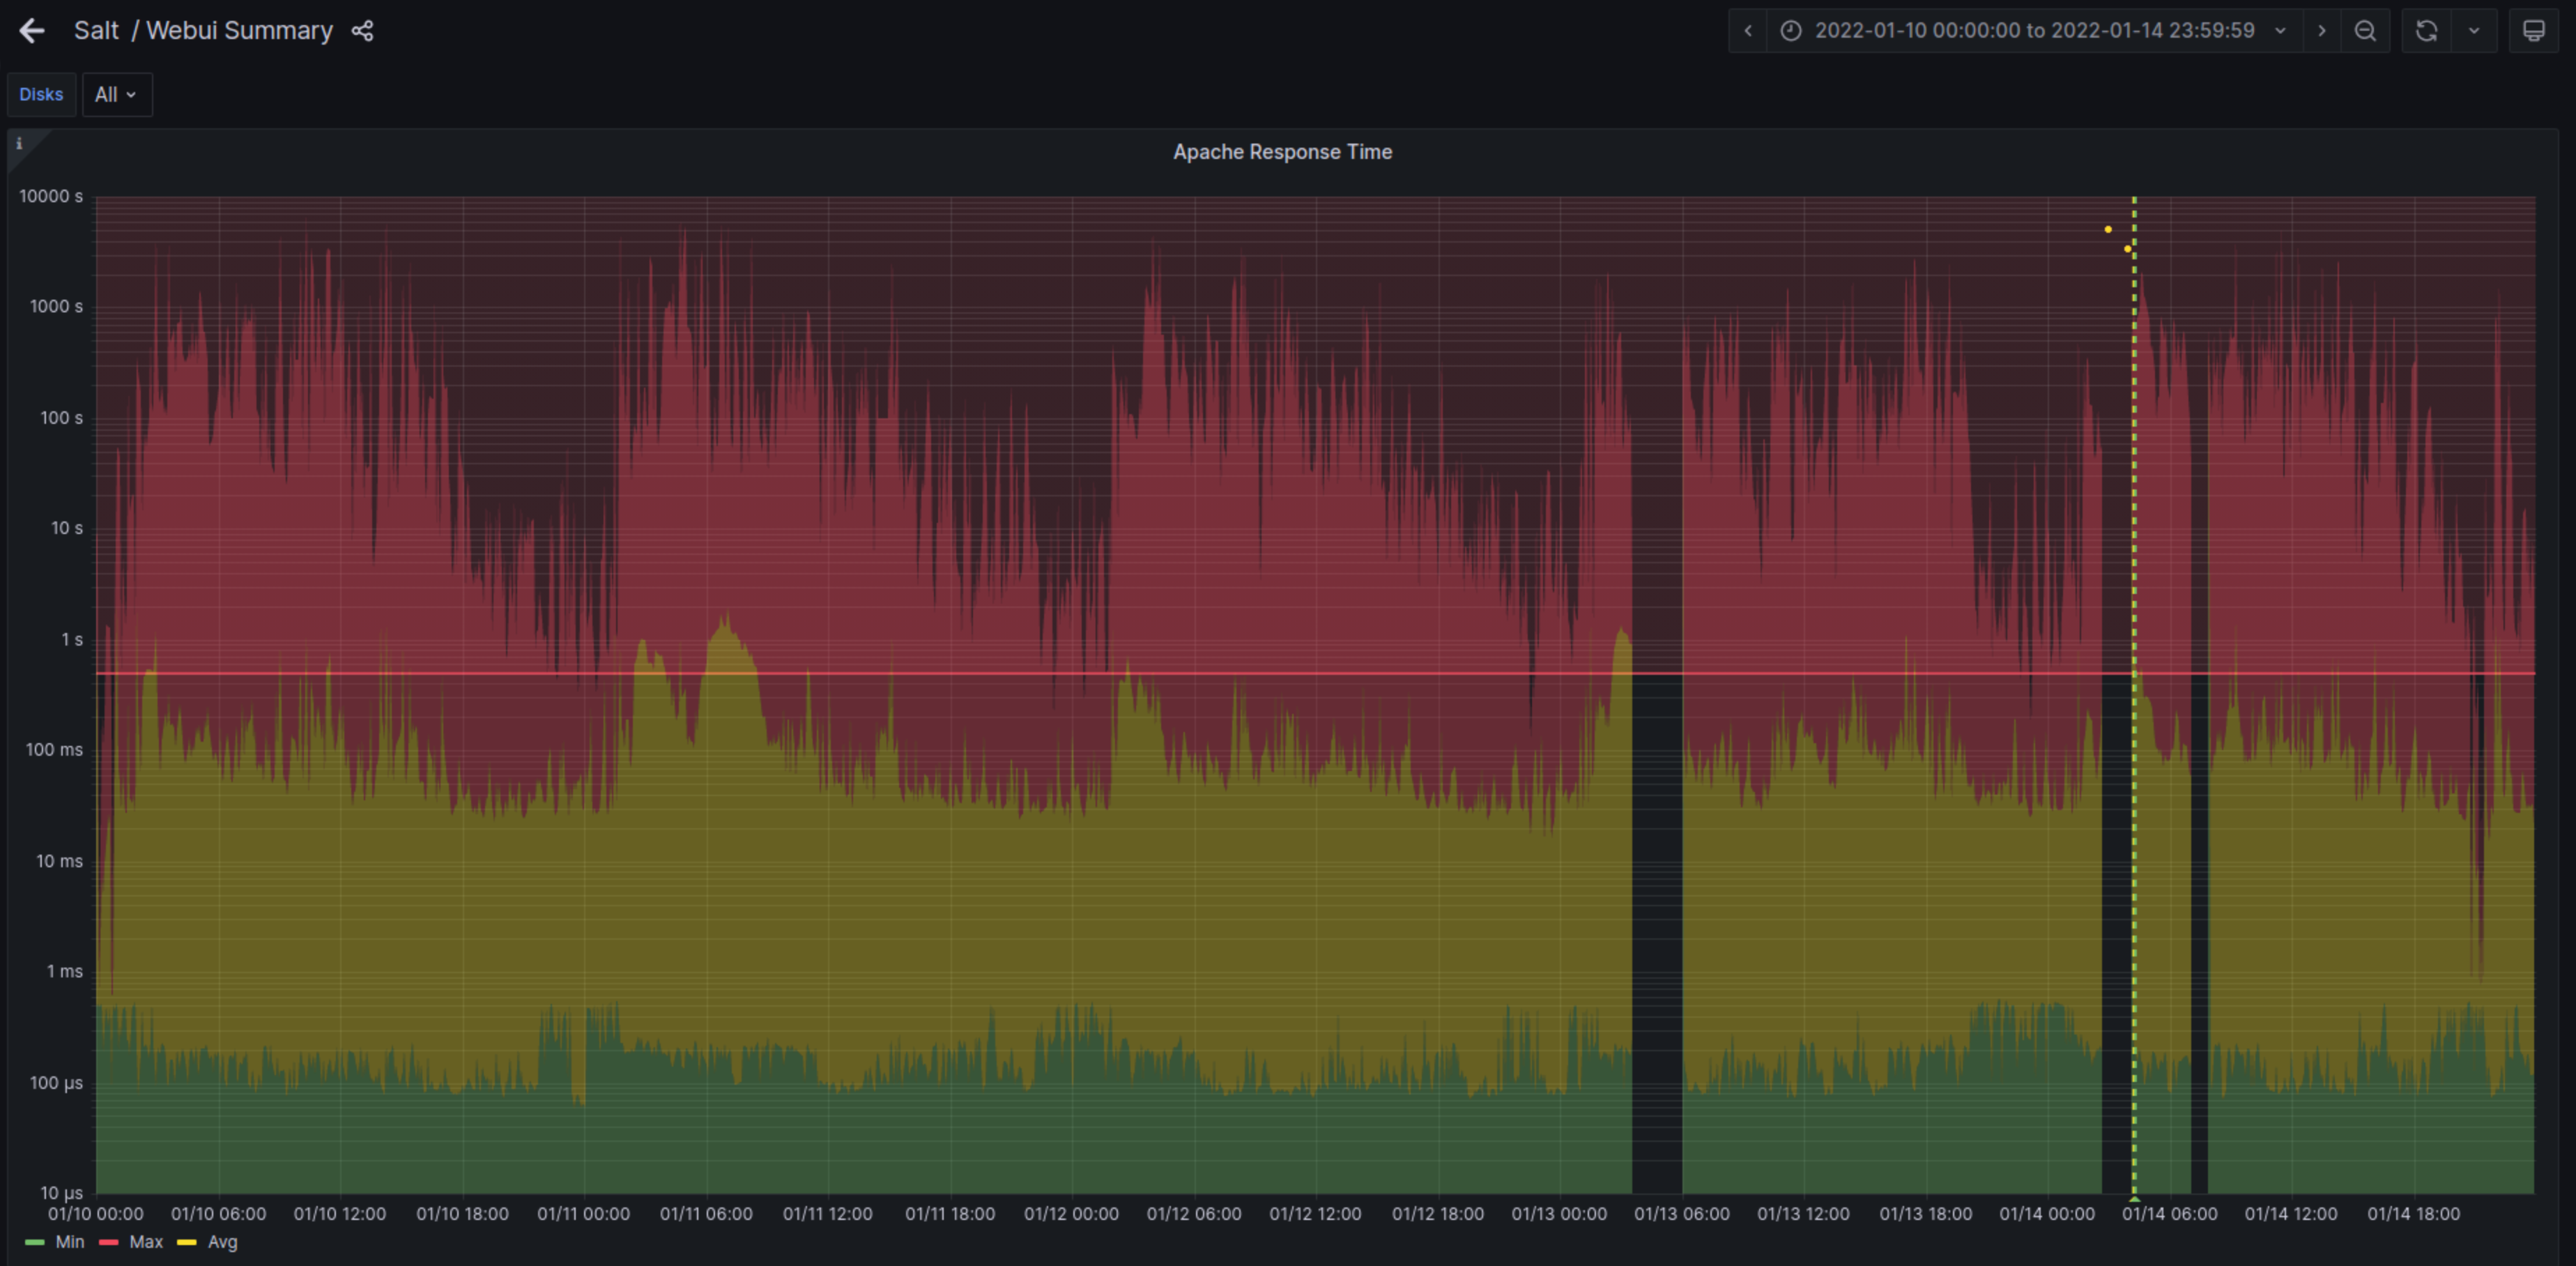
- File year-ago.png year-ago.png added
Also worth mentioning that this metric is based on inputs.tail (using /var/log/apache2/openqa.access_log, which can rotate more than once a day), where #127985 is based on inputs.http_response. Think i actually went into this with the wrong assumptions, expecting it to be a new-ish issue. But looking back at a graph from a year ago, we've always had these holes in the data. Probably from the very start, which makes me think that it might just be logrotate messing with the telegraf data collection.
Updated by kraih almost 2 years ago
It looks like this might have started with the switch from inputs.logparser to inputs.tail. Because the data before the change has no holes. https://gitlab.suse.de/openqa/salt-states-openqa/-/commit/c4e978078c285f5712265347889057ff32ab9bfe
Updated by kraih almost 2 years ago
Actually, i think it might have started with this change for Apache log rotate the day before: https://gitlab.suse.de/openqa/salt-states-openqa/-/commit/659769de466389a844c77f1a4023bd2dc449a092
Updated by kraih almost 2 years ago
Also worth mentioning that there does not appear to be any data missing in the rotated logs. There's countless requests logged during the time influxdb has no data. And the logrotate config already uses copytruncate, which would seem like the correct mode for telegraf inputs.tail. Wonder what else there is that we could try.
Updated by okurz almost 2 years ago
- Description updated (diff)
Discussed in the unblock 2023-04-26. Removed salt and disabled logrotate config for /var/log/apache2/openqa.access_log
salt-key -y -d openqa.suse.de
sed -i 's/^./#&/' /etc/logrotate.d/openqa-apache
and check tomorrow if there are still data gaps
Updated by livdywan almost 2 years ago
Updated by kraih almost 2 years ago
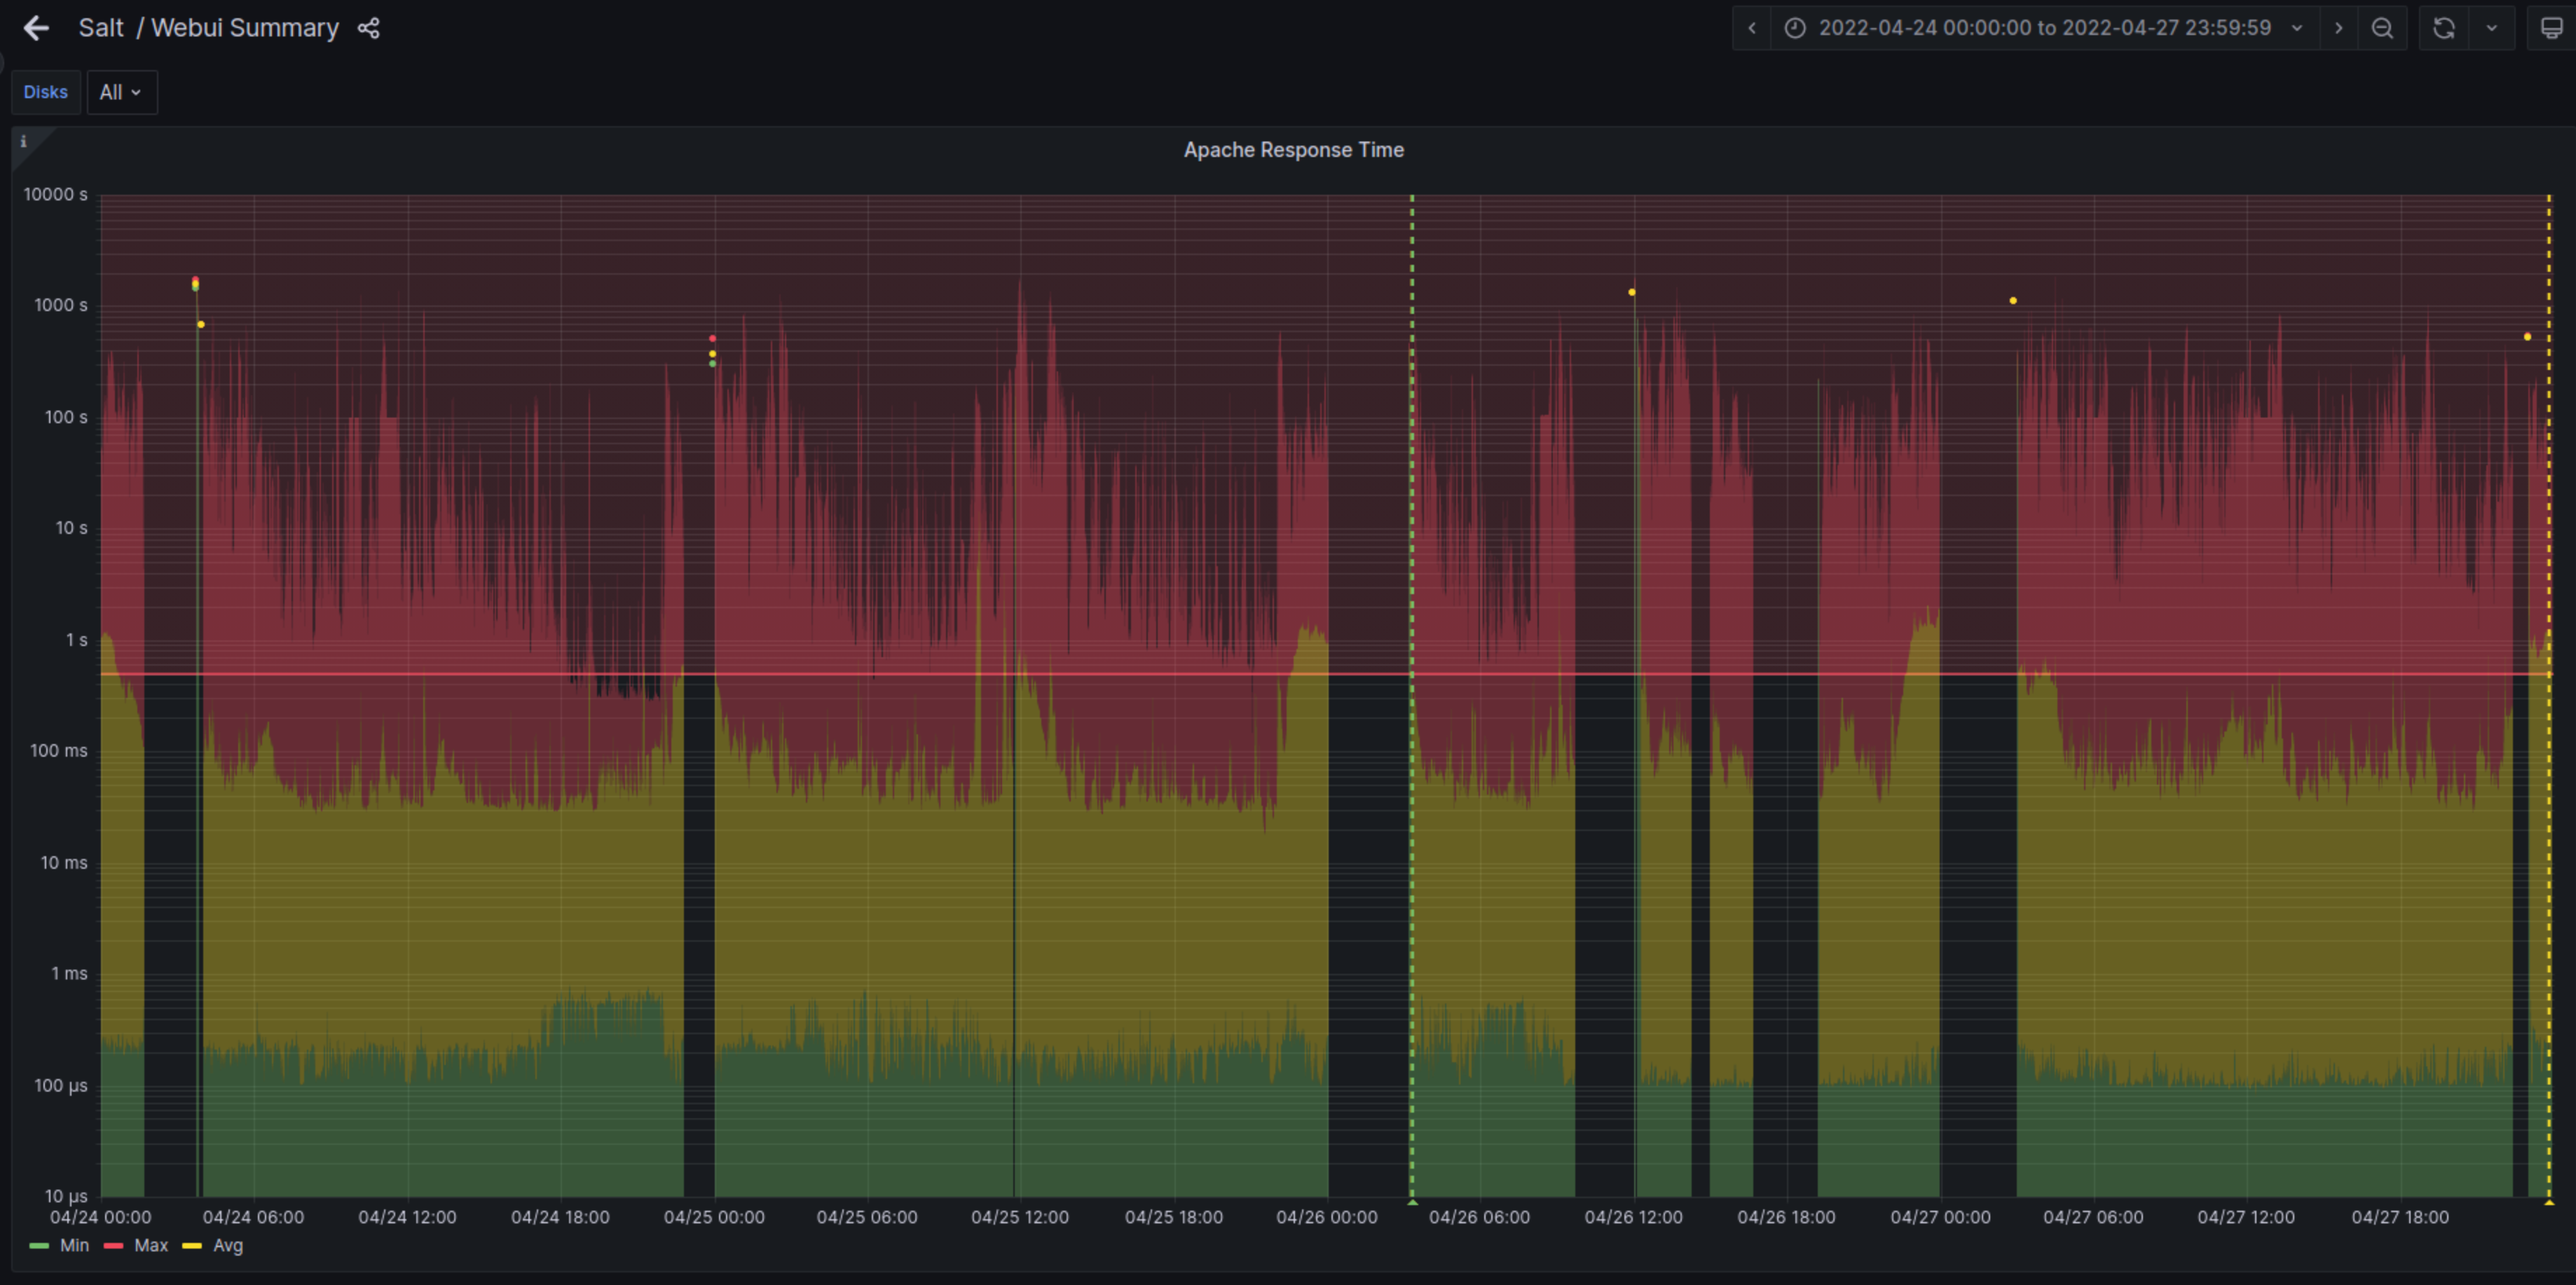
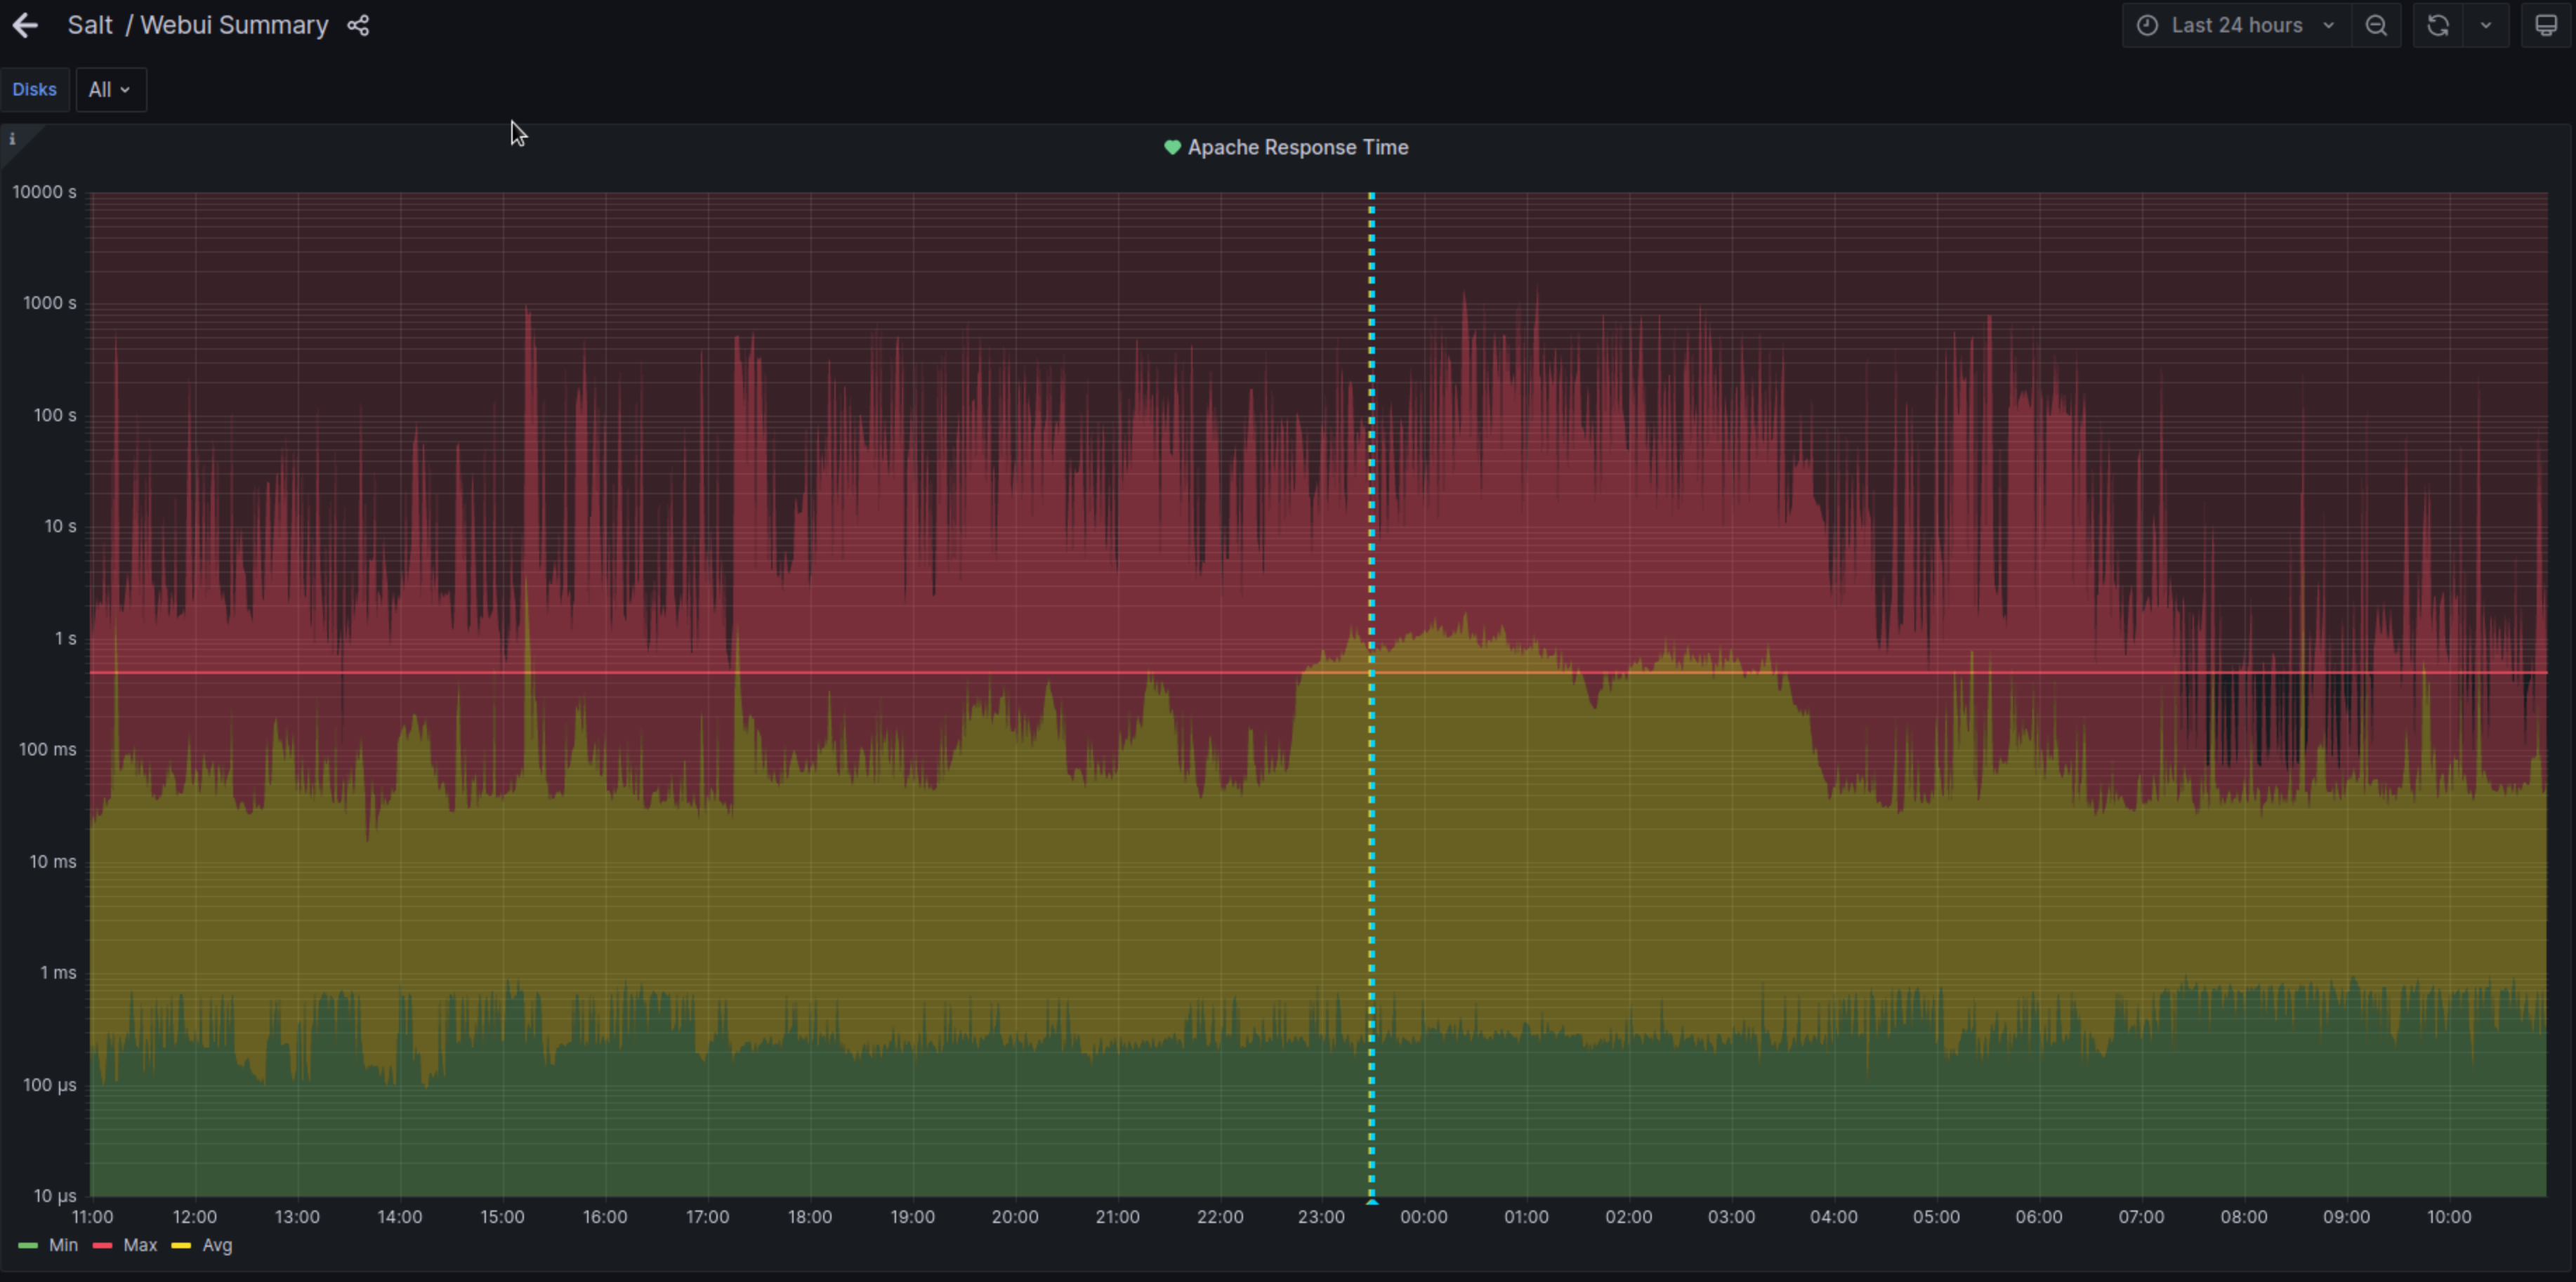
- File 24hours.png 24hours.png added
okurz wrote:
and check tomorrow if there are still data gaps
The graph for the last 24 hours looks clean.
Updated by kraih almost 2 years ago
okurz wrote:
salt-key -y -d openqa.suse.de
sed -i 's/^./#&/' /etc/logrotate.d/openqa-apache
And reverted.
Updated by kraih almost 2 years ago
Now we are going to need ideas for what to change in the logrotate config, theoretically copytruncate should have been correct for our use case:
/var/log/apache2/openqa.access_log {
    compress
    hourly
    maxage 30
    rotate 20
    size=+300000k
    notifempty
    missingok
    copytruncate
    compresscmd /usr/bin/xz
    uncompresscmd /usr/bin/xzdec
}
Updated by kraih almost 2 years ago
There's also a few options to try for the telegraf config:
[[inputs.tail]]
  files = ["/var/log/apache2/openqa.access_log"]
  interval = "30s"
  from_beginning = false
  name_override = "apache_log"
  ## For parsing logstash-style "grok" patterns:
  data_format = "grok"
  grok_patterns = ["%{CUSTOM_LOG}"]
  grok_custom_pattern_files = []
  grok_custom_patterns = '''
      CUSTOM_LOG %{COMBINED_LOG_FORMAT} %{NUMBER:response_time_us:int}
  '''
For example we could try changing the watch method, which defaults to inotify:
  ## Method used to watch for file updates.  Can be either "inotify" or "poll".
  # watch_method = "inotify"
Updated by kraih almost 2 years ago
- Description updated (diff)
I'm now testing watch_method = "poll" in /etc/telegraf/telegraf.d/telegraf-webui.conf on OSD and have disabled salt with salt-key -y -d openqa.suse.de.
Updated by nicksinger almost 2 years ago
I added another silence lasting over the weekend. I can't really tell if the missing series was a problem (wrongly calculated values therefore) or if me need to adjust the alert too. For now it is a good idea anyway to wait for stable metrics before adjusting the alert.
Updated by kraih almost 2 years ago
- Status changed from In Progress to Workable
- Assignee deleted (
kraih)
Putting the ticket back, since i'm out of ideas.
Updated by okurz almost 2 years ago
- Copied to action #128513: Apache Response Time monitoring dashboard is slow to render and should be made lighter added
Updated by okurz almost 2 years ago
- Due date deleted (
2023-05-06) - Status changed from Workable to Resolved
- Assignee set to okurz
ok, so we have currently no silences related to that, no firing alert. I created #128513 to make the data more light weight.
Updated by okurz almost 2 years ago
- Copied to action #128789: [alert] Apache Response Time alert size:M added