coordination #112718
closedopenQA Project (public) - coordination #109846: [epic] Ensure all our database tables accomodate enough data, e.g. bigint for ids
[alert][osd] openqa.suse.de is not reachable anymore, response times > 30s, multiple alerts over the weekend
100%
Description
Observation
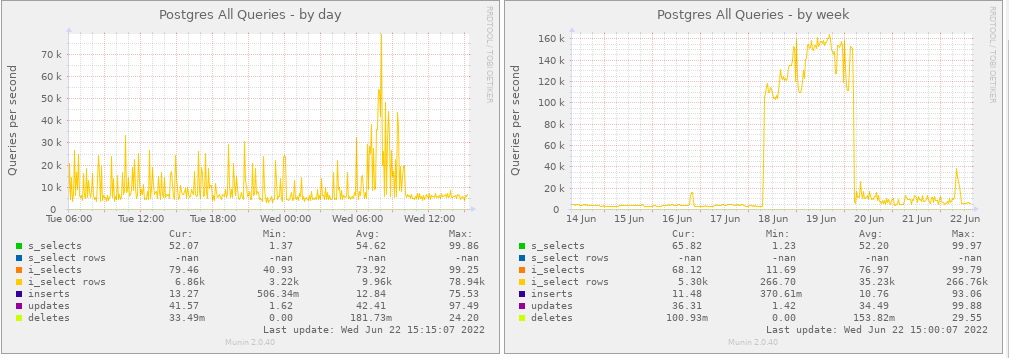
We received a lot of alerts over the weekend regarding failed minion jobs and others. Checking Grafana I can see that the problem started Saturday, 18th of June around 13:00 CET: https://stats.openqa-monitor.qa.suse.de/d/WebuiDb/webui-summary?orgId=1&from=1655549105000&to=now
The amount of returned PostgreSQL rows looks very suspicious and is now five times as high as before: https://stats.openqa-monitor.qa.suse.de/d/WebuiDb/webui-summary?orgId=1&from=1655475539000&to=now&viewPanel=89
Suggestions
- Load OSD database dump from after the incident started and try to reproduce the problem
- Research how to find out where heavy queries come from
- Research what can cause rows returned to grow from <100k to 20-60M
Problem
- H1: The migration to "bigint" has triggered a query planner update causing to end up with sub-optimal routing. As also auto-vacuum is eventually triggering "ANALYZE" we assume that eventually the system would recover automatically by using optimized queries. This is likely what happened on o3 after the period of 1-2 days. On OSD we do not have enough performance headroom (in particular CPU and potentially disk I/O) to cover for such periods.
Rollback and cleanup steps
-
DONE: on osd
systemctl enable --now telegraf -
DONE: on osd
systemctl unmask --now openqa-scheduler-> #112718#note-57 - DONE: Retrigger all incomplete jobs since 2022-06-18 with https://github.com/os-autoinst/scripts/blob/master/openqa-advanced-retrigger-jobs -> #112718#note-57
- DONE: Retrigger failed obs-sync trigger events: https://openqa.suse.de/admin/obs_rsync/
- DONE: Retrigger failed qem-bot trigger events: https://gitlab.suse.de/qa-maintenance/bot-ng/-/pipelines
- DONE: Retrigger failed openQA bot trigger events: https://gitlab.suse.de/qa-maintenance/openQABot/-/pipelines
-
DONE: Unmask and start on openqaworker10 and 13:
sudo systemctl unmask --now openqa-worker-cacheservice openqa-worker@{1..20} - DONE: Remove /etc/openqa/templates/main/index.html.ep
- DONE: Apply salt high state and check that files are back to maintained format, e.g.
- DONE: /usr/share/openqa/script/openqa-gru
-
DONE: on osd
systemctl unmask --now salt-masterand ensure that /etc/telegraf/telegraf.d/telegraf-webui.conf is reverted - Unpause alerts:
- Broken workers
- Failed systemd services (except openqa.suse.de)
- Open database connections by user
- openqa-scheduler.service
- salt-master.service
- web UI: Too many minion job failures
Files
| vaccuum-analyze-o3.txt (16.6 KB) vaccuum-analyze-o3.txt | |||
| o3-munin-pg-rows.png (66.7 KB) o3-munin-pg-rows.png | |||
| vaccuum-analyze-osd.txt (7.9 KB) vaccuum-analyze-osd.txt | |||
| postgres_queries3_openqa-week.png (29.1 KB) postgres_queries3_openqa-week.png | PostgreSQL database queries - week - 2022-06-15 to 2022-06-22 | ||
| Screenshot_20220623_081721_osd_spotty_http_response.png (36.5 KB) Screenshot_20220623_081721_osd_spotty_http_response.png | spotty OSD response starting 2022-06-18, some minutes after "bigint" deployment | ||
| Screenshot_20220623_082117_increase_in_rows_returned_after_bigint_migration.png (71 KB) Screenshot_20220623_082117_increase_in_rows_returned_after_bigint_migration.png | Increase in rows returned in PostgreSQL queries | ||
| Screenshot_20220623_082633_different_mitigations_to_OSD_incident.png (49.4 KB) Screenshot_20220623_082633_different_mitigations_to_OSD_incident.png | Different mitigations as visible in PostgreSQL queries |
Updated by nicksinger almost 3 years ago
From looking at the timestamp I suspect https://github.com/os-autoinst/openQA/pull/4701/commits might be the culprit. It was merged and deployed shortly before we can observe the DB issues and seems to be related.
Updated by nicksinger almost 3 years ago
restarting openqa-webui, apache2 and postgresql provided no improvement of the situation or the metrics in general
Updated by nicksinger almost 3 years ago
I triggered a rollback in https://gitlab.suse.de/openqa/osd-deployment/-/jobs/1020703 which installed 4.6.1655534464.7831729-lp153.5116.1.noarch but I expected to roll back to 4.6.1655450799.f096817-lp153.5115.1 (looking at the deployment log from https://gitlab.suse.de/openqa/osd-deployment/-/jobs/1020699 where I assume the issue was introduced). So I issued:
zypper -n --no-refresh in --oldpackage /var/cache/zypp/packages/devel_openQA/noarch/openQA-4.6.1655450799.f096817-lp153.5115.1.noarch.rpm /var/cache/zypp/packages/devel_openQA/noarch/openQA-client-4.6.1655450799.f096817-lp153.5115.1.noarch.rpm /var/cache/zypp/packages/devel_openQA/noarch/openQA-common-4.^C1655450799.f096817-lp153.5115.1.noarch.rpm
manually now
Updated by okurz almost 3 years ago
- Target version set to Ready
Hm, the web UI was seemingly fine after I monitored the deployment on Saturday
Updated by nicksinger almost 3 years ago
there was a second event at 19th of June at 3:30 CET. At that point the minion jobs rose up to ~1k. From this point on our served requests per second went down from >80 to 25-30. The minion jobs eventually finished but requests/s stayed low all the time. Maybe the highly loaded DB was indeed introduced on Saturday but the unresponsiveness of OSD is unrelated and really started only at Sunday? Question is just what happened in that night? Some automatic update of $something?
Updated by mkittler almost 3 years ago
- Assignee set to mkittler
@okurz indeed has already checked whether https://github.com/os-autoinst/openQA/pull/4701#issuecomment-1159520173= worked correctly. Since I've also tested it locally with the OSD database and the change itself is rather trivial I'd be surprised if it turned out to be the culprit. Note that rolling that change back is a bad idea as it involves a database migration. I hope you've already rolled back the roll back because in that state the setup might be completely broken.
Updated by mkittler almost 3 years ago
Looks like you've already rolled back the roll back. I must say I could reach OSD (also the web UI itself, not just SSH) and it seems ok. The first query took a bit longer than usual, now it feels as fast/slow as usual. Let's see whether there was more load than usual. I'm afraid one can easily slow down the instance with many requests and maybe that's just what happened.
Updated by okurz almost 3 years ago
- Description updated (diff)
- Status changed from New to In Progress
https://monitor.qa.suse.de/d/nRDab3Jiz/openqa-jobs-test?orgId=1&viewPanel=9&from=1655541243880&to=1655560154503 shows that querying the database only provided spotty responses. Problem seems to have appeared since 2022-06-18 12:00. That is just some minutes after the OSD deployment with the migration of the jobs database table.
https://monitor.qa.suse.de/d/WebuiDb/webui-summary?orgId=1&from=1655516807123&to=1655574941005&viewPanel=89 shows that the number of rows in database queries increased significantly. On O3 data got with rsync -a o3:/srv/www/htdocs/munin ~/o3-munin/ we can confirm that there is much more data gathered as soon as the job table migration finished. The number of postgres rows per query per second was in the range of 100-250k, going down to around 10k at around 2022-06-20 04:00.
Updated by okurz almost 3 years ago
- Related to action #112265: Just use bigint in all our database tables (for auto-incremented ID-columns) size:M added
Updated by okurz almost 3 years ago
- Related to action #112736: Better alert based on 2022-06-18 incident size:M added
Updated by okurz almost 3 years ago
- Related to action #112733: Webui Summary dashboard in Grafana is missing I/O panels size:M added
Updated by okurz almost 3 years ago
- Tags set to reactive work
- Subject changed from openqa.suse.de is not reachable anymore, response times > 30s, multiple alerts over the weekend to [alert][osd] openqa.suse.de is not reachable anymore, response times > 30s, multiple alerts over the weekend
Updated by okurz almost 3 years ago
In htop we saw that many postgres processes showed up high in CPU usage. Surprisingly also including "postgres: geekotest openqa [local] idle" show up with high CPU usage, at the top of the list in htop output.
After stopping openqa-scheduler and telegraf and waiting a bit the system settled down so the load was down to sane levels and the webUI snappy in responsiveness. So we started openqa-scheduler again (not yet telegraf), jobs were scheduled to workers. Then I did host=openqa.suse.de failed_since=2022-06-18 openqa-advanced-retrigger-jobs to retrigger incomplete jobs from the past two days. Monitoring …
EDIT: At Mon 2022-06-20 11:33:45 CEST telegraf was started (likely by salt as we can't mask the salt-defined telegraf service), monitoring …
EDIT: The original observation in number of database rows read was returning to normal levels on https://monitor.qa.suse.de/d/WebuiDb/webui-summary?orgId=1&from=1655713537846&to=1655714990694&viewPanel=890 at the time telegraf was restarted.
From the slow queries log we could find:
in /var/lib/pgsql/data.14/log/postgresql-2022-06-18_000000.log:
2022-06-18 12:57:30.073 CEST openqa telegraf [12423]LOG: duration: 1080019.535 ms parse <unnamed>: select count(id) as "incompletes_last_24h" from jobs where result='incomplete' and (reason is null or (reason not like 'quit%' and reason not like 'tests died%' and reason not like 'isotovideo died: Could not find % in complete history%')) and t_finished >= timezone('UTC', now()) - interval '24 hour'
1080019 ms = 1080 s ~ 18 m so corresponding to the actual job database table migration time. So likely this query was just stalled by the actual migration for that time.
EDIT: I retriggered the last failed openqa-review run https://gitlab.suse.de/openqa/openqa-review/-/pipelines/417422
Updated by okurz almost 3 years ago
- Description updated (diff)
I stopped the telegraf service on OSD again as the number of ROWS returned in queries again increased big time: https://monitor.qa.suse.de/d/WebuiDb/webui-summary?orgId=1&viewPanel=89&from=1655731106708&to=1655732168702
I now have stopped the salt master and disabled all postgresql queries in /etc/telegraf/telegraf.d/telegraf-webui.conf, that is "inputs.postgresql" and "inputs.postgresql_extensible.query". Then the situation looked improved so I enabled just "inputs.postgresql" again and it looked like it was fine. But soon after problems reappeared and https://monitor.qa.suse.de/d/WebuiDb/webui-summary?orgId=1&viewPanel=89&from=1655733849979&to=1655734373815&editPanel=89 shows a high number of queries. Keeping that disabled for now.
Updated by mkittler almost 3 years ago
Currently it looks again like PostgreSQL processes using most of the CPU.
I'd really like to know where the high numbers of returned rows comes from. Maybe disabling telegraf has an effect simply because then we have more headroom (as telegraf consumes quite a lot CPU actually). But if it is really telegraf's specific behavior them I'm wondering what has changed (besides changing the datatype of many columns from integer to bigint). Our telegraf version is still from 2019 (so it hasn't been updated recently). PostgreSQL has only been updated on 2022.05.12 but if it was that update we've seen problems earlier.
Updated by mkittler almost 3 years ago
There are quite old "idle" transactions present:
openqa=# SELECT query_start, datname, usename, application_name, state, substring(query, 0, 100) FROM pg_stat_activity order by query_start;
query_start | datname | usename | application_name | state | substring
-------------------------------+---------+-----------+---------------------------------------------------------+---------------------+-----------------------------------------------------------------------------------------------------
2022-06-20 11:09:45.757223+02 | openqa | geekotest | psql | idle | SELECT datname, usename, application_name, substring(query, 0, 100) FROM pg_stat_activity;
2022-06-20 15:53:11.979352+02 | openqa | geekotest | | idle | commit
2022-06-20 15:53:11.981148+02 | openqa | geekotest | | idle | commit
2022-06-20 16:09:36.130027+02 | openqa | geekotest | | idle | SELECT me.id, me.host, me.instance, me.job_id, me.t_seen, me.upload_progress, me.error, me.t_create
2022-06-20 16:18:19.881637+02 | openqa | geekotest | psql | idle | SELECT pid,usename,query_start,query FROM pg_stat_activity order by query_start;
2022-06-20 16:19:35.703789+02 | openqa | geekotest | | idle | INSERT INTO minion_jobs (args, attempts, delayed, expires, lax, notes, parents, priority, queue, ta
2022-06-20 16:20:29.304899+02 | openqa | geekotest | | idle | INSERT INTO minion_jobs (args, attempts, delayed, expires, lax, notes, parents, priority, queue, ta
2022-06-20 16:27:00.692904+02 | openqa | openqa | Metabase v0.41.5 [1c793eea-a361-4c46-a000-945b9db09440] | idle | SHOW TRANSACTION ISOLATION LEVEL
2022-06-20 16:35:13.588848+02 | openqa | geekotest | | idle | SELECT id, args, attempts, +
| | | | | ARRAY(SELECT id FROM minion_jobs WHERE parents @> ARRAY[j.id]) A
2022-06-20 16:40:05.628813+02 | openqa | geekotest | | idle | INSERT INTO minion_jobs (args, attempts, delayed, expires, lax, notes, parents, priority, queue, ta
2022-06-20 16:40:10.893403+02 | openqa | geekotest | | idle | INSERT INTO minion_jobs (args, attempts, delayed, expires, lax, notes, parents, priority, queue, ta
2022-06-20 16:40:14.642845+02 | openqa | postgres | psql | idle | SELECT * FROM pg_stat_activity order by query_start asc;
2022-06-20 16:41:00.721548+02 | openqa | geekotest | | idle | SELECT id, args, attempts, +
| | | | | ARRAY(SELECT id FROM minion_jobs WHERE parents @> ARRAY[j.id]) A
2022-06-20 16:41:02.586926+02 | openqa | geekotest | | idle | INSERT INTO minion_jobs (args, attempts, delayed, expires, lax, notes, parents, priority, queue, ta
2022-06-20 16:41:36.540622+02 | openqa | geekotest | | idle | INSERT INTO minion_jobs (args, attempts, delayed, expires, lax, notes, parents, priority, queue, ta
2022-06-20 16:41:50.577828+02 | openqa | geekotest | | idle | INSERT INTO minion_jobs (args, attempts, delayed, expires, lax, notes, parents, priority, queue, ta
2022-06-20 16:42:50.149756+02 | openqa | geekotest | | idle | SELECT * FROM minion_lock($1, $2, $3)
2022-06-20 16:42:55.301281+02 | openqa | geekotest | | idle | SELECT me.id, me.key, me.value, me.job_id, me.t_created, me.t_updated FROM job_settings me WHERE (
2022-06-20 16:44:00.590942+02 | openqa | geekotest | | idle | SELECT id, args, attempts, +
| | | | | ARRAY(SELECT id FROM minion_jobs WHERE parents @> ARRAY[j.id]) A
2022-06-20 16:44:06.581532+02 | openqa | geekotest | | idle | INSERT INTO minion_jobs (args, attempts, delayed, expires, lax, notes, parents, priority, queue, ta
2022-06-20 16:44:31.381775+02 | openqa | geekotest | | idle | INSERT INTO minion_jobs (args, attempts, delayed, expires, lax, notes, parents, priority, queue, ta
2022-06-20 16:44:36.097757+02 | openqa | geekotest | | idle | INSERT INTO minion_jobs (args, attempts, delayed, expires, lax, notes, parents, priority, queue, ta
2022-06-20 16:45:00.480495+02 | openqa | geekotest | | idle | SELECT id, args, attempts, +
| | | | | ARRAY(SELECT id FROM minion_jobs WHERE parents @> ARRAY[j.id]) A
2022-06-20 16:45:00.770696+02 | openqa | geekotest | | idle | INSERT INTO minion_jobs (args, attempts, delayed, expires, lax, notes, parents, priority, queue, ta
2022-06-20 16:45:01.121066+02 | openqa | geekotest | | idle | SELECT * FROM minion_lock($1, $2, $3)
2022-06-20 16:45:01.281008+02 | openqa | geekotest | | idle | SELECT * FROM minion_lock($1, $2, $3)
2022-06-20 16:45:02.031014+02 | openqa | geekotest | | idle | SELECT me.id, me.job_id, me.name, me.script, me.category, me.milestone, me.important, me.fatal, me.
2022-06-20 16:45:03.430679+02 | openqa | geekotest | | idle | SELECT me.id, me.key, me.value, me.job_id, me.t_created, me.t_updated FROM job_settings me WHERE (
2022-06-20 16:45:10.702231+02 | openqa | geekotest | | idle | INSERT INTO minion_jobs (args, attempts, delayed, expires, lax, notes, parents, priority, queue, ta
2022-06-20 16:45:13.557501+02 | openqa | geekotest | | active | SELECT me.job_id, me.key, me.value FROM job_settings me WHERE ( job_id IN ( $1, $2, $3, $4, $5, $6,
2022-06-20 16:45:15.468303+02 | openqa | geekotest | | idle | INSERT INTO minion_jobs (args, attempts, delayed, expires, lax, notes, parents, priority, queue, ta
2022-06-20 16:45:19.766381+02 | openqa | geekotest | | idle | SELECT me.id, me.key, me.value, me.worker_id, me.t_created, me.t_updated FROM worker_properties me
2022-06-20 16:45:21.040817+02 | openqa | geekotest | | idle | UPDATE minion_jobs SET started = NOW(), state = 'active', worker = $1 +
| | | | | WHERE id = ( +
| | | | | SE
2022-06-20 16:45:21.344238+02 | openqa | geekotest | | idle | UPDATE workers SET t_seen = $1, t_updated = $2 WHERE id = $3
2022-06-20 16:45:21.37856+02 | openqa | geekotest | | idle | SELECT me.id, me.host, me.instance, me.job_id, me.t_seen, me.upload_progress, me.error, me.t_create
2022-06-20 16:45:21.381623+02 | openqa | geekotest | | idle | SELECT me.id, me.host, me.instance, me.job_id, me.t_seen, me.upload_progress, me.error, me.t_create
2022-06-20 16:45:21.445628+02 | openqa | geekotest | | idle | SELECT me.id, me.host, me.instance, me.job_id, me.t_seen, me.upload_progress, me.error, me.t_create
2022-06-20 16:45:21.478339+02 | openqa | geekotest | | idle | SELECT me.id, me.host, me.instance, me.job_id, me.t_seen, me.upload_progress, me.error, me.t_create
2022-06-20 16:45:21.490813+02 | openqa | geekotest | | idle | commit
2022-06-20 16:45:21.551121+02 | openqa | geekotest | | active | commit
2022-06-20 16:45:21.559097+02 | openqa | geekotest | | idle | SELECT me.id, me.result_dir, me.archived, me.state, me.priority, me.result, me.reason, me.clone_id,
2022-06-20 16:45:21.561789+02 | openqa | geekotest | | idle in transaction | DELETE FROM job_template_settings WHERE ( 1=1 AND job_template_id = $1 )
2022-06-20 16:45:21.563018+02 | openqa | postgres | psql | active | SELECT query_start, datname, usename, application_name, state, substring(query, 0, 100) FROM pg_sta
2022-06-20 16:45:21.565214+02 | openqa | geekotest | | idle | SELECT me.id, me.key, me.value, me.worker_id, me.t_created, me.t_updated FROM worker_properties me
2022-06-20 16:45:21.565313+02 | openqa | geekotest | | idle | SELECT me.id, me.key, me.secret, me.user_id, me.t_expiration, me.t_created, me.t_updated FROM api_k
2022-06-20 16:45:21.569787+02 | openqa | geekotest | | idle | SELECT me.id, me.result_dir, me.archived, me.state, me.priority, me.result, me.reason, me.clone_id,
2022-06-20 16:45:21.570506+02 | openqa | geekotest | | idle | SELECT me.id, me.name, me.parent_id, me.size_limit_gb, me.exclusively_kept_asset_size, me.keep_logs
2022-06-20 16:45:21.570765+02 | openqa | geekotest | | idle | SELECT me.id, me.key, me.secret, me.user_id, me.t_expiration, me.t_created, me.t_updated FROM api_k
2022-06-20 16:45:21.570893+02 | openqa | geekotest | | idle in transaction | SELECT me.id, me.name, me.distri, me.version, me.arch, me.flavor, me.description, me.t_created, me.
2022-06-20 16:45:21.571424+02 | openqa | geekotest | | idle in transaction | UPDATE jobs SET result_size = coalesce(result_size, 0) + 390 WHERE id = $1
2022-06-20 16:45:21.571586+02 | openqa | geekotest | | active | UPDATE jobs SET result_size = coalesce(result_size, 0) + 94 WHERE id = $1
2022-06-20 16:45:21.571615+02 | openqa | geekotest | | idle in transaction | SELECT me.id, me.path, me.name FROM needle_dirs me WHERE ( me.path = $1 )
2022-06-20 16:45:21.571675+02 | openqa | geekotest | | idle | SELECT me.id, me.key, me.secret, me.user_id, me.t_expiration, me.t_created, me.t_updated FROM api_k
| | | | |
| | | | |
| | | | |
| | | | |
| | postgres | | |
(58 Zeilen)
I'm wondering whether it is normal that queries like SELECT datname, usename, application_name, substring(query, 0, 100) FROM pg_stat_activity; show up there after several hours. The state "idle" means that the server is waiting for further client commands (see https://www.postgresql.org/docs/current/monitoring-stats.html#MONITORING-PG-STAT-ACTIVITY-VIEW). So likely clients got stuck somehow.
Updated by mkittler almost 3 years ago
On htop is currently looks normal again and we haven't done anything and telegraf is also still running (stayed on top of top for a while now).
Updated by mkittler almost 3 years ago
- Assignee deleted (
mkittler)
This is likely a team effort. Of course I'm currently still having an eye on OSD but I'm not quite sure what else to try.
Updated by mkittler almost 3 years ago
Now OSD seems very busy again due to PostgreSQL processes. Now the table also contains much more "active" entries:
openqa=# SELECT query_start, datname, usename, application_name, state, substring(query, 0, 100) FROM pg_stat_activity order by query_start;
query_start | datname | usename | application_name | state | substring
-------------------------------+---------+-----------+---------------------------------------------------------+--------+-----------------------------------------------------------------------------------------------------
2022-06-20 15:53:11.979352+02 | openqa | geekotest | | idle | commit
2022-06-20 15:53:11.981148+02 | openqa | geekotest | | idle | commit
2022-06-20 16:09:36.130027+02 | openqa | geekotest | | idle | SELECT me.id, me.host, me.instance, me.job_id, me.t_seen, me.upload_progress, me.error, me.t_create
2022-06-20 16:18:19.881637+02 | openqa | geekotest | psql | idle | SELECT pid,usename,query_start,query FROM pg_stat_activity order by query_start;
2022-06-20 16:40:14.642845+02 | openqa | postgres | psql | idle | SELECT * FROM pg_stat_activity order by query_start asc;
2022-06-20 17:28:21.67681+02 | openqa | geekotest | | idle | SELECT id, args, attempts, +
| | | | | ARRAY(SELECT id FROM minion_jobs WHERE parents @> ARRAY[j.id]) A
2022-06-20 17:43:00.078259+02 | openqa | geekotest | | idle | SELECT id, args, attempts, +
| | | | | ARRAY(SELECT id FROM minion_jobs WHERE parents @> ARRAY[j.id]) A
2022-06-20 17:46:59.011506+02 | openqa | geekotest | | idle | SELECT id, args, attempts, +
| | | | | ARRAY(SELECT id FROM minion_jobs WHERE parents @> ARRAY[j.id]) A
2022-06-20 17:55:04.717213+02 | openqa | geekotest | | idle | SELECT id, args, attempts, +
| | | | | ARRAY(SELECT id FROM minion_jobs WHERE parents @> ARRAY[j.id]) A
2022-06-20 18:09:01.072006+02 | openqa | geekotest | | idle | INSERT INTO minion_jobs (args, attempts, delayed, expires, lax, notes, parents, priority, queue, ta
2022-06-20 18:09:01.732867+02 | openqa | geekotest | | idle | INSERT INTO minion_jobs (args, attempts, delayed, expires, lax, notes, parents, priority, queue, ta
2022-06-20 18:23:57.836248+02 | openqa | geekotest | | idle | SELECT id, args, attempts, +
| | | | | ARRAY(SELECT id FROM minion_jobs WHERE parents @> ARRAY[j.id]) A
2022-06-20 18:26:24.017472+02 | openqa | geekotest | | idle | SELECT id, args, attempts, +
| | | | | ARRAY(SELECT id FROM minion_jobs WHERE parents @> ARRAY[j.id]) A
2022-06-20 18:27:00.868847+02 | openqa | openqa | Metabase v0.41.5 [1c793eea-a361-4c46-a000-945b9db09440] | idle | SET SESSION CHARACTERISTICS AS TRANSACTION ISOLATION LEVEL READ COMMITTED
2022-06-20 18:27:26.781695+02 | openqa | geekotest | | idle | SELECT id, args, attempts, +
| | | | | ARRAY(SELECT id FROM minion_jobs WHERE parents @> ARRAY[j.id]) A
2022-06-20 18:30:37.903551+02 | openqa | geekotest | | idle | SELECT id, args, attempts, +
| | | | | ARRAY(SELECT id FROM minion_jobs WHERE parents @> ARRAY[j.id]) A
2022-06-20 18:31:01.562997+02 | openqa | geekotest | | idle | SELECT id, args, attempts, +
| | | | | ARRAY(SELECT id FROM minion_jobs WHERE parents @> ARRAY[j.id]) A
2022-06-20 18:31:24.876955+02 | openqa | geekotest | | idle | SELECT id, args, attempts, +
| | | | | ARRAY(SELECT id FROM minion_jobs WHERE parents @> ARRAY[j.id]) A
2022-06-20 18:32:00.094124+02 | openqa | geekotest | | idle | SELECT id, args, attempts, +
| | | | | ARRAY(SELECT id FROM minion_jobs WHERE parents @> ARRAY[j.id]) A
2022-06-20 18:33:00.090944+02 | openqa | geekotest | | idle | SELECT id, args, attempts, +
| | | | | ARRAY(SELECT id FROM minion_jobs WHERE parents @> ARRAY[j.id]) A
2022-06-20 18:35:58.704286+02 | openqa | geekotest | | idle | SELECT id, args, attempts, +
| | | | | ARRAY(SELECT id FROM minion_jobs WHERE parents @> ARRAY[j.id]) A
2022-06-20 18:36:02.063913+02 | openqa | geekotest | psql | idle | SELECT query_start, datname, usename, application_name, state, substring(query, 0, 130) FROM pg_sta
2022-06-20 18:36:50.946515+02 | openqa | geekotest | | idle | SELECT id, args, attempts, +
| | | | | ARRAY(SELECT id FROM minion_jobs WHERE parents @> ARRAY[j.id]) A
2022-06-20 18:37:54.474491+02 | openqa | geekotest | | idle | SELECT id, args, attempts, +
| | | | | ARRAY(SELECT id FROM minion_jobs WHERE parents @> ARRAY[j.id]) A
2022-06-20 18:38:49.596377+02 | openqa | geekotest | | idle | SELECT id, args, attempts, +
| | | | | ARRAY(SELECT id FROM minion_jobs WHERE parents @> ARRAY[j.id]) A
2022-06-20 18:39:57.849006+02 | openqa | geekotest | | idle | SELECT id, args, attempts, +
| | | | | ARRAY(SELECT id FROM minion_jobs WHERE parents @> ARRAY[j.id]) A
2022-06-20 18:40:32.636164+02 | openqa | geekotest | | active | SELECT me.job_id, me.key, me.value FROM job_settings me WHERE ( job_id IN ( $1, $2, $3, $4, $5, $6,
2022-06-20 18:40:32.812207+02 | openqa | geekotest | | active | SELECT me.job_id, me.key, me.value FROM job_settings me WHERE ( job_id IN ( $1, $2, $3, $4, $5, $6,
2022-06-20 18:40:33.945533+02 | openqa | geekotest | | active | SELECT me.job_id, me.key, me.value FROM job_settings me WHERE ( job_id IN ( $1, $2, $3, $4, $5, $6,
2022-06-20 18:40:38.148794+02 | openqa | geekotest | | active | SELECT me.job_id, me.key, me.value FROM job_settings me WHERE ( job_id IN ( $1, $2, $3, $4, $5, $6,
2022-06-20 18:40:42.843475+02 | openqa | geekotest | | active | SELECT me.id, me.job_id, me.name, me.script, me.category, me.milestone, me.important, me.fatal, me.
2022-06-20 18:40:43.634786+02 | openqa | geekotest | | active | SELECT me.id, me.job_id, me.name, me.script, me.category, me.milestone, me.important, me.fatal, me.
2022-06-20 18:40:50.997009+02 | openqa | geekotest | | active | SELECT me.job_id, me.key, me.value FROM job_settings me WHERE ( job_id IN ( $1, $2, $3, $4, $5, $6,
2022-06-20 18:40:51.131714+02 | openqa | geekotest | | active | SELECT me.job_id, me.key, me.value FROM job_settings me WHERE ( job_id IN ( $1, $2, $3, $4, $5, $6,
2022-06-20 18:40:51.131714+02 | openqa | geekotest | | active | SELECT me.job_id, me.key, me.value FROM job_settings me WHERE ( job_id IN ( $1, $2, $3, $4, $5, $6,
2022-06-20 18:40:51.19938+02 | openqa | geekotest | | active | SELECT me.id, me.job_id, me.name, me.script, me.category, me.milestone, me.important, me.fatal, me.
2022-06-20 18:40:51.709221+02 | openqa | geekotest | | active | SELECT me.job_id, me.key, me.value FROM job_settings me WHERE ( job_id IN ( $1, $2, $3, $4, $5, $6,
2022-06-20 18:40:52.993528+02 | openqa | geekotest | | active | SELECT me.job_id, me.key, me.value FROM job_settings me WHERE ( job_id IN ( $1, $2, $3, $4, $5, $6,
2022-06-20 18:40:53.13511+02 | openqa | geekotest | | active | SELECT me.job_id, me.key, me.value FROM job_settings me WHERE ( job_id IN ( $1, $2, $3, $4, $5 ) )
2022-06-20 18:40:53.742739+02 | openqa | geekotest | | active | SELECT me.id, me.job_id, me.name, me.script, me.category, me.milestone, me.important, me.fatal, me.
2022-06-20 18:40:53.742739+02 | openqa | geekotest | | active | SELECT me.id, me.job_id, me.name, me.script, me.category, me.milestone, me.important, me.fatal, me.
2022-06-20 18:40:53.742739+02 | openqa | geekotest | | active | SELECT me.id, me.job_id, me.name, me.script, me.category, me.milestone, me.important, me.fatal, me.
2022-06-20 18:40:54.852891+02 | openqa | geekotest | | active | SELECT me.id, me.job_id, me.name, me.script, me.category, me.milestone, me.important, me.fatal, me.
2022-06-20 18:40:55.713767+02 | openqa | geekotest | | active | SELECT me.job_id, me.key, me.value FROM job_settings me WHERE ( job_id IN ( $1, $2, $3, $4, $5, $6,
2022-06-20 18:40:55.713767+02 | openqa | geekotest | | active | SELECT me.job_id, me.key, me.value FROM job_settings me WHERE ( job_id IN ( $1, $2, $3, $4, $5, $6,
2022-06-20 18:40:55.713767+02 | openqa | geekotest | | active | SELECT me.job_id, me.key, me.value FROM job_settings me WHERE ( job_id IN ( $1, $2, $3, $4, $5, $6,
2022-06-20 18:40:58.176247+02 | openqa | geekotest | | active | SELECT me.id, me.job_id, me.name, me.script, me.category, me.milestone, me.important, me.fatal, me.
2022-06-20 18:40:58.613466+02 | openqa | geekotest | | active | SELECT me.job_id, me.key, me.value FROM job_settings me WHERE ( job_id IN ( $1, $2, $3, $4, $5, $6,
2022-06-20 18:40:58.785535+02 | openqa | geekotest | | active | SELECT me.job_id, me.key, me.value FROM job_settings me WHERE ( job_id IN ( $1, $2, $3, $4, $5, $6,
2022-06-20 18:40:58.785535+02 | openqa | geekotest | | active | SELECT me.job_id, me.key, me.value FROM job_settings me WHERE ( job_id IN ( $1, $2, $3, $4, $5, $6,
2022-06-20 18:40:58.785535+02 | openqa | geekotest | | active | SELECT me.job_id, me.key, me.value FROM job_settings me WHERE ( job_id IN ( $1, $2, $3, $4, $5, $6,
2022-06-20 18:40:59.631355+02 | openqa | geekotest | | active | SELECT me.id, me.job_id, me.name, me.script, me.category, me.milestone, me.important, me.fatal, me.
2022-06-20 18:40:59.810243+02 | openqa | geekotest | | idle | LISTEN "minion.job"
2022-06-20 18:41:01.985724+02 | openqa | geekotest | | active | SELECT me.ARCH, COUNT( id ) FROM jobs me WHERE ( ( state = $1 OR state = $2 OR state = $3 OR state
2022-06-20 18:41:01.986292+02 | openqa | geekotest | | idle | SELECT me.id, me.key, me.value, me.worker_id, me.t_created, me.t_updated FROM worker_properties me
2022-06-20 18:41:02.045514+02 | openqa | postgres | psql | active | SELECT query_start, datname, usename, application_name, state, substring(query, 0, 100) FROM pg_sta
| | postgres | | |
| | | | |
| | | | |
| | | | |
| | | | |
(61 Zeilen)
It doesn't look like there is one single, active and very extensive query slowing everything down. Here the oldest active query is "only" about 30 seconds old (and that's still the case just before I've submitted the comment).
Note that despite all the PostgreSQL processes, telegraf is still often the process with the highest CPU usage.
Updated by okurz almost 3 years ago
- Assignee set to mkittler
Note that despite all the PostgreSQL processes, telegraf is still often the process with the highest CPU usage.
yes, I don't think this is our real problem but it's disturbing. Using lsof -p $pid_of_telegraf while telegraf was again very CPU-busy I found that telegraf hogs /var/log/apache2/openqa.access_log so I temporarily also disabled that part in /etc/telegraf/telegraf.d/telegraf-webui.conf and restarted telegraf
Problem still persists big time. Maybe vacuuming helps?
In SQL looking for number of dead rows:
openqa=> SELECT relname, n_dead_tup FROM pg_stat_user_tables order by n_dead_tup desc;
                relname                | n_dead_tup
---------------------------------------+------------
 job_modules                           |    4513455
 audit_events                          |      95793
 job_settings                          |      55442
 screenshot_links                      |      40758
 jobs_assets                           |      35508
 jobs                                  |      19742
...
so does not look that severe I must say. And auto-vacuum seems to work in general:
openqa=> SELECT relname, last_vacuum, last_autovacuum FROM pg_stat_user_tables order by last_autovacuum desc;
                relname                | last_vacuum |        last_autovacuum
---------------------------------------+-------------+-------------------------------
 workers                               |             | 2022-06-20 20:41:19.318891+02
 minion_locks                          |             | 2022-06-20 20:34:19.254702+02
 needles                               |             | 2022-06-20 20:31:19.614321+02
 worker_properties                     |             | 2022-06-20 20:17:20.372615+02
 job_locks                             |             | 2022-06-20 20:17:19.204195+02
 minion_jobs                           |             | 2022-06-20 20:05:25.508087+02
 jobs                                  |             | 2022-06-20 19:43:28.198877+02
 gru_tasks                             |             | 2022-06-20 16:51:17.245578+02
 job_template_settings                 |             | 2022-06-20 16:37:17.36953+02
 job_networks                          |             | 2022-06-20 15:40:16.304795+02
 job_templates                         |             | 2022-06-20 13:20:15.194067+02
 job_groups                            |             | 2022-06-18 06:05:09.115597+02
 job_group_parents                     |             | 2022-06-18 04:12:08.412239+02
 gru_dependencies                      |             | 2022-06-17 09:16:19.67674+02
 assets                                |             | 2022-06-17 03:37:18.259471+02
 users                                 |             | 2022-06-14 07:26:03.404364+02
 minion_workers                        |             | 2022-06-12 22:50:19.164182+02
 jobs_assets                           |             | 2022-06-12 22:00:50.876807+02
 comments                              |             | 2022-06-12 19:24:56.38826+02
 audit_events                          |             | 2022-06-11 03:01:46.881216+02
 developer_sessions                    |             | 2022-06-11 02:20:50.322238+02
 pgbench_history                       |             | 2022-06-10 17:37:46.193947+02
 products                              |             | 2022-06-10 17:37:45.972252+02
 secrets                               |             | 2022-06-10 17:37:45.928548+02
 product_settings                      |             | 2022-06-10 17:37:45.903805+02
 pgbench_tellers                       |             | 2022-06-10 17:37:45.748611+02
 pgbench_branches                      |             | 2022-06-10 17:37:45.729228+02
 pgbench_accounts                      |             | 2022-06-10 17:37:45.407887+02
 needle_dirs                           |             | 2022-06-10 17:37:45.370069+02
 machine_settings                      |             | 2022-06-10 17:37:45.364742+02
 machines                              |             | 2022-06-10 17:37:45.34+02
 mojo_migrations                       |             | 2022-06-10 17:37:45.311193+02
 dbix_class_deploymenthandler_versions |             | 2022-06-10 17:37:45.270007+02
 api_keys                              |             | 2022-06-10 17:37:45.234455+02
 screenshots                           |             | 2022-06-09 01:54:35.386361+02
 screenshot_links                      |             | 2022-06-08 23:25:46.075765+02
 scheduled_products                    |             | 2022-06-07 03:07:58.464646+02
 bugs                                  |             | 2022-06-06 18:13:36.687914+02
 test_suite_settings                   |             | 2022-06-05 20:56:59.367662+02
 test_suites                           |             | 2022-06-05 20:56:59.268058+02
 job_settings                          |             | 2022-06-05 15:49:20.523256+02
 job_modules                           |             | 2022-06-05 15:35:58.496185+02
 job_dependencies                      |             | 2022-06-05 15:24:20.863533+02
anyway, let's do some vacuum'ing, started vacuum job_modules. Took only some seconds actually.
Updated by okurz almost 3 years ago
- Description updated (diff)
To reduce the load on OSD further I stopped on openqaworker10 and openqaworker13:
sudo systemctl mask --now openqa-worker-cacheservice
sudo systemctl stop --now openqa-worker@{1..20}
Updated by openqa_review almost 3 years ago
- Due date set to 2022-07-05
Setting due date based on mean cycle time of SUSE QE Tools
Updated by okurz almost 3 years ago
- Related to action #54902: openQA on osd fails at "incomplete" status when uploading, "502 response: Proxy Error" added
Updated by okurz almost 3 years ago
Situation persists after the night. Disabling index page content on osd with /etc/openqa/templates/main/index.html.ep:
% layout 'bootstrap';
% title '';

%= include 'layouts/info'

<div class="jumbotron">
  <div class='container'>
    <div class="row">
      <div class="col-md-9">
        %= include_branding 'docbox'
      </div>
      <div class="col-md-3 hidden-sm-down">
        %= include_branding 'sponsorbox'
      </div>
    </div>
  </div>
</div>

<div id="build-results">
Build results on the index page are temporarily disabled due to performance reasons, Use <a href="/tests">/tests</a> or the job group pages as usual. See <a href="https://progress.opensuse.org/issues/112718">https://progress.opensuse.org/issues/112718</a> for details
</div>
and re-enabled telegraf including
[[inputs.postgresql]]
  address = "postgres://telegraf:telegraf@localhost"
  databases = ["openqa"]
but with the extensible queries still disabled. I patched
/usr/share/openqa/script/openqa-gru with
-    exec "$(dirname "$0")"/openqa gru -m production run --reset-locks --jobs 4 --spare 2 --spare-min-priority 10 "$@"
+    exec "$(dirname "$0")"/openqa gru -m production run --reset-locks --jobs 1 --spare 1 --spare-min-priority 10 "$@"
and restarted again openqa-webui keeping openqa-scheduler disabled. Running now since 04:53Z. At 05:19Z the number of rows in db queries reduced again, see https://monitor.qa.suse.de/d/WebuiDb/webui-summary?orgId=1&viewPanel=89&from=1655788673653&to=1655788908586, and the HTTP response was going back to ok, see https://monitor.qa.suse.de/d/WebuiDb/webui-summary?orgId=1&from=1655786494609&to=1655788954840&viewPanel=78. At 05:22Z I triggered host=openqa.suse.de failed_since=2022-06-20 openqa-advanced-retrigger-jobs and the load increased again as well as rows.
Saw the error in journalctl -u openqa-webui:
Query returned more than one row. SQL that returns multiple rows is DEPRECATED for ->find and ->single at /usr/share/openqa/script/../lib/OpenQA/Schema/ResultSet/Jobs.pm line 455
created https://github.com/os-autoinst/openQA/pull/4711
but also what just happened between 05:52Z and 05:57Z is that system was fine. I don't think I triggered anything just before or during that time that would explain the fall or rise of rows in queries.
Andrea Manzini suggests that "Maybe a join between a BIGINT index and another int index type can impact WHERE performance" and shared https://dba.stackexchange.com/questions/298546/massive-slowdown-after-doing-an-alter-to-change-index-from-int-to-bigint-with-p
EDIT: 2022-06-21 07:06Z: In telegraf config also disabled inputs.http on "https://openqa.suse.de/admin/influxdb/jobs" and "https://openqa.suse.de/admin/influxdb/minion" and inputs.http_response. After the restart of the telegraf service and some seconds system was fine. Re-enabling inputs.http_response, system was fine for 4m and triggering host=openqa.suse.de failed_since=2022-06-20 openqa-advanced-retrigger-jobs, now back to bad, aborted the triggering. Disabling inputs.http_response again. Does not help.
Looking again at SQL queries:
openqa=> SELECT pid,usename,query_start,substring(query,0,86) FROM pg_stat_activity order by query_start;
  pid  |  usename  |          query_start          |                                       substring
-------+-----------+-------------------------------+---------------------------------------------------------------------------------------
 24456 | geekotest | 2022-06-21 06:53:35.543298+02 | commit
  3990 | geekotest | 2022-06-21 08:00:34.85894+02  | commit
  7480 | geekotest | 2022-06-21 08:14:12.051326+02 | SELECT id, args, attempts,                                                           +
       |           |                               |         ARRAY(SELECT id FROM minion_jobs WHERE parents @>
 17314 | geekotest | 2022-06-21 08:42:04.670668+02 | SELECT id, args, attempts,                                                           +
       |           |                               |         ARRAY(SELECT id FROM minion_jobs WHERE parents @>
…
       |           |                               |         ARRAY(SELECT id FROM minion_jobs WHERE parents @>
  5738 | geekotest | 2022-06-21 09:05:38.740128+02 | SELECT id, args, attempts,                                                           +
       |           |                               |         ARRAY(SELECT id FROM minion_jobs WHERE parents @>
  7597 | geekotest | 2022-06-21 09:15:49.939796+02 | INSERT INTO minion_jobs (args, attempts, delayed, expires, lax, notes, parents, prior
  4017 | geekotest | 2022-06-21 09:20:31.270498+02 | SELECT me.job_id, me.key, me.value FROM job_settings me WHERE ( job_id IN ( $1, $2, $
…
  4089 | geekotest | 2022-06-21 09:20:55.170348+02 | SELECT me.job_id, me.key, me.value FROM job_settings me WHERE ( job_id IN ( $1, $2, $
  5379 | geekotest | 2022-06-21 09:20:55.510838+02 | SELECT pid,usename,query_start,substring(query,0,86) FROM pg_stat_activity order by q
I found https://dba.stackexchange.com/a/254881 and I ran SELECT relname, idx_tup_fetch + seq_tup_read as TotalReads from pg_stat_all_tables WHERE idx_tup_fetch + seq_tup_read != 0 order by TotalReads desc LIMIT 10; and found
openqa=> SELECT relname, idx_tup_fetch + seq_tup_read as TotalReads from pg_stat_all_tables WHERE idx_tup_fetch + seq_tup_read != 0 order by TotalReads desc LIMIT 10;
      relname      |  totalreads
-------------------+---------------
 job_settings      | 2685939163697
 job_modules       | 2342063226540
in comparison on o3:
openqa=> SELECT pid,usename,query_start,substring(query,0,80) FROM pg_stat_activity order by query_start limit 30;
  pid  |  usename  |          query_start          |                                    substring                                        -------+-----------+-------------------------------+---------------------------------------------------------------------------------
 18160 | geekotest | 2022-06-20 00:14:53.901486+00 | commit                                                                               18560 | geekotest | 2022-06-20 00:14:58.747555+00 | commit                                                                                2427 | geekotest | 2022-06-21 07:11:58.143169+00 | INSERT INTO minion_jobs (args, attempts, delayed, expires, lax, notes, parents,
…
 24958 | geekotest | 2022-06-21 07:53:16.324832+00 | INSERT INTO minion_jobs (args, attempts, delayed, expires, lax, notes, parents,
 31158 | geekotest | 2022-06-21 07:54:33.745098+00 | SELECT me.id, me.key, me.value, me.worker_id, me.t_created, me.t_updated FROM w
 10697 | geekotest | 2022-06-21 07:55:46.477673+00 | INSERT INTO minion_jobs (args, attempts, delayed, expires, lax, notes, parents,
 12408 | geekotest | 2022-06-21 07:56:03.70419+00  | INSERT INTO minion_jobs (args, attempts, delayed, expires, lax, notes, parents,
 30543 | geekotest | 2022-06-21 07:56:29.057656+00 | INSERT INTO minion_jobs (args, attempts, delayed, expires, lax, notes, parents,
 10397 | geekotest | 2022-06-21 07:56:37.525445+00 | SELECT me.id, me.key, me.value, me.worker_id, me.t_created, me.t_updated FROM w
 28060 | geekotest | 2022-06-21 07:58:08.415517+00 | INSERT INTO minion_jobs (args, attempts, delayed, expires, lax, notes, parents,
 28527 | geekotest | 2022-06-21 07:58:35.025503+00 | INSERT INTO minion_jobs (args, attempts, delayed, expires, lax, notes, parents,
 27209 | geekotest | 2022-06-21 07:58:55.712136+00 | SELECT me.id, me.key, me.value, me.worker_id, me.t_created, me.t_updated FROM w
 18158 | geekotest | 2022-06-21 07:58:57.926236+00 | commit                                                                               31704 | geekotest | 2022-06-21 07:59:09.13175+00  | SELECT me.id, me.job_id, me.name, me.script, me.category, me.milestone, me.impo
 24271 | geekotest | 2022-06-21 07:59:09.482646+00 | commit                                                                               23629 | geekotest | 2022-06-21 07:59:09.804277+00 | commit                                                                               29684 | geekotest | 2022-06-21 07:59:10.066043+00 | SELECT me.id, me.name, parent.id, parent.name, parent.size_limit_gb, parent.exc
16456 | geekotest | 2022-06-21 07:59:10.710438+00 | commit                                                                                8391 | geekotest | 2022-06-21 07:59:11.240238+00 | commit                                                                              (30 rows)

openqa=> SELECT relname, idx_tup_fetch + seq_tup_read as TotalReads from pg_stat_all_tables WHERE idx_tup_fetch + seq_tup_read != 0 order by TotalReads desc LIMIT 10;                                                                                                                  relname      | totalreads                                                                                                          -------------------+-------------                                                                                                          jobs              | 54544263781
screenshot_links  | 53035020881                                                                                                          job_modules       | 44651212061                                                                                                          job_settings      | 38973147673
so job modules and job_settings are more heavy on OSD but there also those two "commit queries" running for multiple hours. So I guess that is expected.
Trying to play around with postgres settings. In /srv/PSQL/data/postgresql.conf setting temporarily:
max_worker_processes = 2
autovacuum = off                                                                                                                        autovacuum_max_workers = 2
but cdywan and me saw quickly that autovacuum does not seem to make a difference so we went back to enable autovacuum again but limit the processes. However in the process table in htop I still see many more processes. Not sure why.
Updated by okurz almost 3 years ago
- Related to action #112769: errors from telegraf on osd webUI "[inputs.procstat] Error in plugin: open /sys/fs/cgroup/systemd/system.slice/salt-master.service/cgroup.procs: no such file or directory", same for openqa-scheduler.service added
Updated by mkittler almost 3 years ago
It looks like certain queries got a little bit more involved:
With integer:
openqa-osd=> EXPLAIN ANALYZE SELECT me.id, me.job_id, me.name, me.script, me.category, me.milestone, me.important, me.fatal, me.always_rollback, me.result, me.t_created, me.t_updated FROM job_modules me WHERE ( job_id IN ( 4425040, 2000550, 5148279, 8608569, 4264509, 8882574, 8610731, 3699583, 8608570, 8512897 ) )  ORDER BY id;
                                                                      QUERY PLAN
-------------------------------------------------------------------------------------------------------------------------------------------------------
 Sort  (cost=22477.63..22493.38 rows=6299 width=97) (actual time=0.313..0.328 rows=100 loops=1)
   Sort Key: id
   Sort Method: quicksort  Memory: 45kB
   ->  Index Scan using job_modules_idx_job_id on job_modules me  (cost=0.56..22080.13 rows=6299 width=97) (actual time=0.036..0.200 rows=100 loops=1)
         Index Cond: (job_id = ANY ('{4425040,2000550,5148279,8608569,4264509,8882574,8610731,3699583,8608570,8512897}'::integer[]))
 Planning Time: 0.237 ms
 Execution Time: 0.375 ms
With bigint:
openqa-local-bitint2=> EXPLAIN ANALYZE SELECT me.id, me.job_id, me.name, me.script, me.category, me.milestone, me.important, me.fatal, me.always_rollback, me.result, me.t_created, me.t_updated FROM job_modules me WHERE ( job_id IN ( 4425040, 2000550, 5148279, 8608569, 4264509, 8882574, 8610731, 3699583, 8608570, 8512897 ) )  ORDER BY id;
                                                                QUERY PLAN
------------------------------------------------------------------------------------------------------------------------------------------
 Sort  (cost=428.49..430.63 rows=856 width=110) (actual time=0.021..0.021 rows=0 loops=1)
   Sort Key: id
   Sort Method: quicksort  Memory: 25kB
   ->  Bitmap Heap Scan on job_modules me  (cost=49.54..386.80 rows=856 width=110) (actual time=0.017..0.018 rows=0 loops=1)
         Recheck Cond: (job_id = ANY ('{4425040,2000550,5148279,8608569,4264509,8882574,8610731,3699583,8608570,8512897}'::bigint[]))
         ->  Bitmap Index Scan on job_modules_idx_job_id  (cost=0.00..49.33 rows=856 width=0) (actual time=0.016..0.016 rows=0 loops=1)
               Index Cond: (job_id = ANY ('{4425040,2000550,5148279,8608569,4264509,8882574,8610731,3699583,8608570,8512897}'::bigint[]))
 Planning Time: 0.103 ms
 Execution Time: 0.050 ms
That is a random query but one that shows up very persistently often on pg_stat_activity in production.
However, if I increase the number of jobs I can also get Bitmap scans on the database using integer:
openqa-osd=> EXPLAIN ANALYZE VERBOSE SELECT me.id, me.job_id, me.name, me.script, me.category, me.milestone, me.important, me.fatal, me.always_rollback, me.result, me.t_created, me.t_updated FROM job_modules me WHERE ( job_id IN ( 4425040, 2000550, 5148279, 8608569, 4264509, 8882574, 8610731, 3699583, 8608570, 8512897, 8995727, 8995725, 8995724, 8995723, 8995722, 8995721, 8995720, 8995719, 8995718, 8995717, 8995716, 8995715, 8995714, 8995713, 8995712, 8995711, 8991717 ) )  ORDER BY id;
                                                                                                                                      QUERY PLAN
--------------------------------------------------------------------------------------------------------------------------------------------------------------------------------------------------------------------------------------------------------------------------------------
 Sort  (cost=57624.99..57667.26 rows=16909 width=97) (actual time=0.488..0.498 rows=100 loops=1)
   Output: id, job_id, name, script, category, milestone, important, fatal, always_rollback, result, t_created, t_updated
   Sort Key: me.id
   Sort Method: quicksort  Memory: 45kB
   ->  Bitmap Heap Scan on public.job_modules me  (cost=362.18..56437.52 rows=16909 width=97) (actual time=0.164..0.440 rows=100 loops=1)
         Output: id, job_id, name, script, category, milestone, important, fatal, always_rollback, result, t_created, t_updated
         Recheck Cond: (me.job_id = ANY ('{4425040,2000550,5148279,8608569,4264509,8882574,8610731,3699583,8608570,8512897,8995727,8995725,8995724,8995723,8995722,8995721,8995720,8995719,8995718,8995717,8995716,8995715,8995714,8995713,8995712,8995711,8991717}'::integer[]))
         Heap Blocks: exact=32
         ->  Bitmap Index Scan on job_modules_idx_job_id  (cost=0.00..357.95 rows=16909 width=0) (actual time=0.144..0.144 rows=100 loops=1)
               Index Cond: (me.job_id = ANY ('{4425040,2000550,5148279,8608569,4264509,8882574,8610731,3699583,8608570,8512897,8995727,8995725,8995724,8995723,8995722,8995721,8995720,8995719,8995718,8995717,8995716,8995715,8995714,8995713,8995712,8995711,8991717}'::integer[]))
 Planning Time: 0.509 ms
 Execution Time: 0.524 ms
Also see these findings: https://gist.github.com/perlpunk/82186212a8048aa9aa67b51021785c68
Updated by tinita almost 3 years ago
That's basically what I wrote yesterday:
explain SELECT me.id, me.job_id, me.name, me.script, me.category, me.milestone, me.important, me.fatal, me.always_rollback,
  me.result, me.t_created, me.t_updated FROM job_modules me
  WHERE ( job_id IN ( '8958389', '8958386', '8958385', '8958384', '8958382', '8958379', '8958378', '8958387', '8958383' ) ) ;

osd:
                                                       QUERY PLAN
------------------------------------------------------------------------------------------------------------------------

 Gather  (cost=1000.02..810951.35 rows=1322252 width=100)
   Workers Planned: 2
   ->  Parallel Seq Scan on job_modules me  (cost=0.02..677726.15 rows=550938 width=100)
         Filter: (job_id = ANY ('{8958389,8958386,8958385,8958384,8958382,8958379,8958378,8958387,8958383}'::bigint[]))
 JIT:
   Functions: 4
   Options: Inlining true, Optimization true, Expressions true, Deforming true
(7 rows)

osd-backup:
                                                      QUERY PLAN
-----------------------------------------------------------------------------------------------------------------------
 Index Scan using job_modules_idx_job_id on job_modules me  (cost=0.56..26620.81 rows=7410 width=96)
   Index Cond: (job_id = ANY ('{8958389,8958386,8958385,8958384,8958382,8958379,8958378,8958387,8958383}'::integer[]))
(2 rows)
so for some reason maybe the index isn't completely updated, or something like that?
Updated by livdywan almost 3 years ago
I set work_mem = 64MB in /srv/PSQL/data/postgresql.conf (the default is 4MB), hypothesizing that our queries need more memory and we have plenty to spare on the host. See work_mem for details.
I also ran host=openqa.suse.de failed_since=2022-06-20 openqa-advanced-retrigger-jobs again, and it doesn't seem to trigger any excessive load so far.
Updated by okurz almost 3 years ago
- Copied to action #112787: Use different users for our database accesses so that we can debug where load comes from added
Updated by okurz almost 3 years ago
Decided together that we start the openQA scheduler again, time 2022-06-21 1000Z
Also re-enabled openqaworker10+13
Updated by kraih almost 3 years ago
We ran a SELECT pg_stat_reset(); to reset the postgres internal stats on OSD, and then checked number of sequential scans per table after about 30 minutes to see what might still not be using indexes:
openqa=# SELECT relname, seq_scan FROM pg_stat_all_tables WHERE schemaname = 'public' ORDER BY seq_scan DESC;
                relname                | seq_scan
---------------------------------------+----------
 api_keys                              |    76009
 needle_dirs                           |    30016
 assets                                |    14618
 machines                              |    11309
 job_group_parents                     |     6883
 job_networks                          |     2754
 worker_properties                     |     2722
 job_locks                             |     1855
 machine_settings                      |      826
 minion_workers                        |      628
 job_groups                            |      500
 minion_locks                          |      350
 job_dependencies                      |      171
 comments                              |      166
 jobs_assets                           |       89
 job_modules                           |       82
 job_settings                          |       65
 minion_jobs                           |       58
...
Especially the api_keys table would probably benefit from an index, but nothing here seems to hint at a regression.
Updated by mkittler almost 3 years ago
Does anybody know by which storage this is backed up, e.g. whether fragmentation could be relevant?
Btw, I've just checked the fragmentation but it is likely not very meaningful:
xfs_db -c frag -r /dev/vdb
actual 33425, ideal 12866, fragmentation factor 61.51%
Note, this number is largely meaningless.
Files on this filesystem average 2.60 extents per file
Updated by mkittler almost 3 years ago
Enabled https://www.postgresql.org/docs/current/pgstatstatements.html so now we see what queries consume the most time, e.g. right now it looks like this:
openqa=# SELECT substring(query from 0 for 150), calls, total_exec_time, rows, 100.0 * shared_blks_hit, nullif(shared_blks_hit + shared_blks_read, 0) AS hit_percent FROM pg_stat_statements ORDER BY total_exec_time DESC LIMIT 10;
                                                                       substring                                                                       | calls  |  total_exec_time   |  rows  |  ?column?   | hit_percent
-------------------------------------------------------------------------------------------------------------------------------------------------------+--------+--------------------+--------+-------------+-------------
 SELECT me.id, me.state FROM jobs me LEFT JOIN job_dependencies parents ON parents.child_job_id = me.id WHERE ( ( parents.dependency = $1 AND parents. |  11186 | 57889.722659999934 |  23359 | 120218900.0 |     1202311
 SELECT me.id, me.result_dir, me.archived, me.state, me.priority, me.result, me.reason, me.clone_id, me.blocked_by_id, me.backend_info, me.TEST, me.DI |   2933 |  36148.81717100014 |   1837 | 542564500.0 |     5460719
 SELECT me.id FROM jobs me  JOIN workers worker ON worker.job_id = me.id LEFT JOIN worker_properties properties ON properties.worker_id = worker.id WH |  15979 | 23198.560466000126 |  15979 | 268065500.0 |     2680799
 INSERT INTO screenshots (filename, t_created) VALUES($1, now()) ON CONFLICT DO NOTHING RETURNING id                                                   |  19659 | 17995.110622000033 |   4342 |  14959000.0 |      164103
 UPDATE jobs SET result_size = coalesce(result_size, $2) + $3 WHERE id = $1                                                                            | 134370 |  16381.78018200026 | 134370 |  96970800.0 |      969788
 SELECT me.id, me.job_id, me.name, me.script, me.category, me.milestone, me.important, me.fatal, me.always_rollback, me.result, me.t_created, me.t_upd |  15222 | 15547.122149000006 | 637284 |  24320700.0 |      255512
 SELECT me.id, me.key, me.secret, me.user_id, me.t_expiration, me.t_created, me.t_updated FROM api_keys me WHERE ( me.key = $1 )                       | 166927 | 11042.243285999979 | 166927 |  50077800.0 |      500781
 SELECT me.id, me.result_dir, me.archived, me.state, me.priority, me.result, me.reason, me.clone_id, me.blocked_by_id, me.backend_info, me.TEST, me.DI | 196408 | 10516.395611999904 | 196393 |  82562900.0 |      825925
 SELECT COUNT(*) FILTER (WHERE state = $1 AND (expires IS NULL OR expires > NOW())) AS inactive_jobs,                                                 +|    256 |  9128.634249000002 |    256 |  57935100.0 |      579351
        COUNT(*) FILTER (WHERE state = $2) AS act                                                                                                      |        |                    |        |             |
 DELETE FROM screenshot_links WHERE job_id = $1                                                                                                        |     99 |  7502.062859999999 |   1888 |    234500.0 |        2453
(10 Zeilen)
Updated by mkittler almost 3 years ago
There are no job IDs which haven't been correctly converted to bigint. However, I found one other inconsistency. The assigned_worker_id of the jobs table has already been converted to bigint despite the workers table still using integer for its IDs. That's a mistake in my migration. https://github.com/os-autoinst/openQA/pull/4705 would fix that.
It doesn't look like it confuses the query planner too much:
openqa=# EXPLAIN ANALYZE SELECT assigned_worker.host, COUNT( job_id ) FROM jobs me LEFT JOIN workers assigned_worker ON assigned_worker.id = me.assigned_worker_id WHERE ( ( state = 'assigned' OR state = 'setup' OR state = 'running' OR state = 'uploading' ) )  GROUP BY assigned_worker.host;
                                                                                      QUERY PLAN
---------------------------------------------------------------------------------------------------------------------------------------------------------------------------------------
 GroupAggregate  (cost=1587.45..1589.84 rows=107 width=22) (actual time=16.924..16.994 rows=17 loops=1)
   Group Key: assigned_worker.host
   ->  Sort  (cost=1587.45..1587.89 rows=176 width=22) (actual time=16.910..16.934 rows=232 loops=1)
         Sort Key: assigned_worker.host
         Sort Method: quicksort  Memory: 43kB
         ->  Nested Loop Left Join  (cost=20.25..1580.89 rows=176 width=22) (actual time=5.531..16.721 rows=232 loops=1)
               ->  Bitmap Heap Scan on jobs me  (cost=19.22..693.35 rows=176 width=8) (actual time=5.504..15.279 rows=232 loops=1)
                     Recheck Cond: (((state)::text = 'assigned'::text) OR ((state)::text = 'setup'::text) OR ((state)::text = 'running'::text) OR ((state)::text = 'uploading'::text))
                     Heap Blocks: exact=107
                     ->  BitmapOr  (cost=19.22..19.22 rows=176 width=0) (actual time=3.073..3.075 rows=0 loops=1)
                           ->  Bitmap Index Scan on idx_jobs_state  (cost=0.00..4.43 rows=1 width=0) (actual time=0.050..0.050 rows=787 loops=1)
                                 Index Cond: ((state)::text = 'assigned'::text)
                           ->  Bitmap Index Scan on idx_jobs_state  (cost=0.00..4.43 rows=1 width=0) (actual time=0.007..0.007 rows=2 loops=1)
                                 Index Cond: ((state)::text = 'setup'::text)
                           ->  Bitmap Index Scan on idx_jobs_state  (cost=0.00..5.75 rows=176 width=0) (actual time=2.089..2.089 rows=23748 loops=1)
                                 Index Cond: ((state)::text = 'running'::text)
                           ->  Bitmap Index Scan on idx_jobs_state  (cost=0.00..4.43 rows=1 width=0) (actual time=0.926..0.926 rows=10002 loops=1)
                                 Index Cond: ((state)::text = 'uploading'::text)
               ->  Bitmap Heap Scan on workers assigned_worker  (cost=1.03..5.04 rows=1 width=26) (actual time=0.004..0.004 rows=1 loops=232)
                     Recheck Cond: (id = me.assigned_worker_id)
                     Heap Blocks: exact=232
                     ->  Bitmap Index Scan on workers_pkey  (cost=0.00..1.03 rows=1 width=0) (actual time=0.002..0.002 rows=1 loops=232)
                           Index Cond: (id = me.assigned_worker_id)
 Planning Time: 0.443 ms
 Execution Time: 17.066 ms
(25 Zeilen)
Updated by mkittler almost 3 years ago
One of the most problematic queries¹ is https://github.com/os-autoinst/openQA/blob/7831729203bc69d52c1e2806aed4e3ec94f45ca7/lib/OpenQA/WebAPI/Controller/API/V1/Job.pm#L175. At least that piece of code matches the queries that show up since I've enabled pg_stat_statements with the highest total execution time. Maybe the list API route is used more frequently with many job IDs which causes the slow down? If the performance is worse again, we could comment-out the code that does this kind of queries in production to see whether it makes a difference.
(I couldn't find any other place in the code which would produce such queries. https://github.com/os-autoinst/openQA/blob/7831729203bc69d52c1e2806aed4e3ec94f45ca7/lib/OpenQA/Scheduler/Model/Jobs.pm#L418 only matches almost because the queries we see don't have a filter on the key.)
¹found via:
openqa=# SELECT substring(query from 0 for 250) as query_start, sum(calls) as calls, max(max_exec_time) as met, sum(total_exec_time) as tet, sum(rows) as rows FROM pg_stat_statements group by query_start ORDER BY tet DESC LIMIT 10;
-[ RECORD 1 ]----------------------------------------------------------------------------------------------------------------------------------------------------------------------------------------------------------------------------------------------------------
query_start | SELECT me.job_id, me.key, me.value FROM job_settings me WHERE ( job_id IN ( $1, $2, $3, $4, $5, $6, $7, $8, $9, $10, $11, $12, $13, $14, $15, $16, $17, $18, $19, $20, $21, $22, $23, $24, $25, $26, $27, $28, $29, $30, $31, $32, $33, $34, $35, $36, $3
calls       | 584
met         | 28560.55648
tet         | 913098.727907
rows        | 1952845
-[ RECORD 2 ]----------------------------------------------------------------------------------------------------------------------------------------------------------------------------------------------------------------------------------------------------------
query_start | SELECT me.job_id, me.asset_id, me.created_by, me.t_created, me.t_updated, asset.id, asset.type, asset.name, asset.size, asset.checksum, asset.last_use_job_id, asset.fixed, asset.t_created, asset.t_updated FROM jobs_assets me  JOIN assets asset ON as
calls       | 8865
met         | 1865.7281289999999
tet         | 593939.254908
rows        | 151213
-[ RECORD 3 ]----------------------------------------------------------------------------------------------------------------------------------------------------------------------------------------------------------------------------------------------------------
query_start | SELECT me.id, me.state FROM jobs me LEFT JOIN job_dependencies parents ON parents.child_job_id = me.id WHERE ( ( parents.dependency = $1 AND parents.parent_job_id = $2 ) )
calls       | 81672
met         | 101.098989
tet         | 425916.96886900044
rows        | 168600
-[ RECORD 4 ]----------------------------------------------------------------------------------------------------------------------------------------------------------------------------------------------------------------------------------------------------------
query_start | SELECT me.id, me.result_dir, me.archived, me.state, me.priority, me.result, me.reason, me.clone_id, me.blocked_by_id, me.backend_info, me.TEST, me.DISTRI, me.VERSION, me.FLAVOR, me.ARCH, me.BUILD, me.MACHINE, me.group_id, me.assigned_worker_id, me.t
calls       | 964256
met         | 1354.680613
tet         | 187154.11510900036
rows        | 1271759
-[ RECORD 5 ]----------------------------------------------------------------------------------------------------------------------------------------------------------------------------------------------------------------------------------------------------------
query_start | SELECT me.id FROM jobs me  JOIN workers worker ON worker.job_id = me.id LEFT JOIN worker_properties properties ON properties.worker_id = worker.id WHERE ( ( properties.key = $1 AND properties.value = $2 ) )
calls       | 109973
met         | 41.073029
tet         | 167114.40476700084
rows        | 109973
-[ RECORD 6 ]----------------------------------------------------------------------------------------------------------------------------------------------------------------------------------------------------------------------------------------------------------
query_start | INSERT INTO screenshots (filename, t_created) VALUES($1, now()) ON CONFLICT DO NOTHING RETURNING id
calls       | 135829
met         | 1026.34991
tet         | 85657.04680500003
rows        | 28607
-[ RECORD 7 ]----------------------------------------------------------------------------------------------------------------------------------------------------------------------------------------------------------------------------------------------------------
query_start | SELECT COUNT(*) FILTER (WHERE state = $1 AND (expires IS NULL OR expires > NOW())) AS inactive_jobs,                                                                                                                                                     +
            |        COUNT(*) FILTER (WHERE state = $2) AS active_jobs, COUNT(*) FILTER (WHERE state = $3) AS failed_jobs,                                                                                                                                             +
            |        COUNT(*) FILTER (WHERE state = $
calls       | 1608
met         | 188.65970800000002
tet         | 62490.039718000044
rows        | 1608
-[ RECORD 8 ]----------------------------------------------------------------------------------------------------------------------------------------------------------------------------------------------------------------------------------------------------------
query_start | SELECT me.job_id, me.key, me.value FROM job_settings me WHERE ( job_id IN ( $1, $2, $3, $4, $5, $6, $7, $8, $9, $10, $11, $12 ) )
calls       | 637
met         | 305.744556
tet         | 60380.40600099997
rows        | 323044
-[ RECORD 9 ]----------------------------------------------------------------------------------------------------------------------------------------------------------------------------------------------------------------------------------------------------------
query_start | UPDATE jobs SET result_size = coalesce(result_size, $2) + $3 WHERE id = $1
calls       | 468611
met         | 64.75113400000001
tet         | 59930.441230999284
rows        | 468611
-[ RECORD 10 ]---------------------------------------------------------------------------------------------------------------------------------------------------------------------------------------------------------------------------------------------------------
query_start | SELECT me.child_job_id, me.parent_job_id, me.dependency FROM job_dependencies me WHERE ( ( parent_job_id IN ( $1, $2, $3, $4, $5, $6, $7, $8, $9, $10, $11, $12, $13, $14, $15, $16, $17, $18, $19, $20, $21, $22, $23, $24, $25, $26, $27, $28, $29, $30
calls       | 596
met         | 1906.845699
tet         | 59614.28428699999
rows        | 41357
That's what the analyzer has to say about the query:
openqa=# EXPLAIN ANALYZE SELECT me.job_id, me.key, me.value FROM job_settings me WHERE ( job_id IN ( 4425040, 2000550, 5148279, 8608569, 4264509, 8882574, 8610731, 3699583, 8608570, 8512897, 8995727, 8995725, 8995724, 8995723, 8995722, 8995721, 8995720, 8995719, 8995718, 8995717, 8995716, 8995715, 8995714, 8995713, 8995712, 8995711, 8991717 ) );
                                                                                                                                 QUERY PLAN
----------------------------------------------------------------------------------------------------------------------------------------------------------------------------------------------------------------------------------------------------------------------------
 Bitmap Heap Scan on job_settings me  (cost=52568.91..622097.79 rows=4758325 width=58) (actual time=254.571..255.472 rows=1194 loops=1)
   Recheck Cond: (job_id = ANY ('{4425040,2000550,5148279,8608569,4264509,8882574,8610731,3699583,8608570,8512897,8995727,8995725,8995724,8995723,8995722,8995721,8995720,8995719,8995718,8995717,8995716,8995715,8995714,8995713,8995712,8995711,8991717}'::bigint[]))
   Heap Blocks: exact=40
   ->  Bitmap Index Scan on job_settings_idx_job_id  (cost=0.00..51379.26 rows=4758325 width=0) (actual time=29.249..29.249 rows=1219 loops=1)
         Index Cond: (job_id = ANY ('{4425040,2000550,5148279,8608569,4264509,8882574,8610731,3699583,8608570,8512897,8995727,8995725,8995724,8995723,8995722,8995721,8995720,8995719,8995718,8995717,8995716,8995715,8995714,8995713,8995712,8995711,8991717}'::bigint[]))
 Planning Time: 0.590 ms
 JIT:
   Functions: 4
   Options: Inlining true, Optimization true, Expressions true, Deforming true
   Timing: Generation 0.832 ms, Inlining 136.936 ms, Optimization 57.956 ms, Emission 30.189 ms, Total 225.913 ms
 Execution Time: 441.821 ms
(11 Zeilen)
Updated by mkittler almost 3 years ago
but with the extensible queries still disabled. I patched
/usr/share/openqa/script/openqa-gru with
I've reverted that patching since performance doesn't look too bad right now and Minion jobs are piling up. I suppose they're mainly filesystem-extensive anyways.
Updated by mkittler almost 3 years ago
It doesn't look too bad right now. Performance is normal and htop looks normal. So I'll leave it as-is for today (scheduler is running and GRU with 4 jobs, index page still disabled).
Updated by kraih almost 3 years ago
mkittler wrote:
One of the most problematic queries¹ is https://github.com/os-autoinst/openQA/blob/7831729203bc69d52c1e2806aed4e3ec94f45ca7/lib/OpenQA/WebAPI/Controller/API/V1/Job.pm#L175. At least that piece of code matches the queries that show up since I've enabled pg_stat_statements with the highest total execution time. Maybe the list API route is used more frequently with many job IDs which causes the slow down? If the performance is worse again, we could comment-out the code that does this kind of queries in production to see whether it makes a difference.
Opened a PR to turn the IN into an ANY, that will combine all the variations with different numbers of placeholders into one query in the stats. https://github.com/os-autoinst/openQA/pull/4713
Updated by okurz almost 3 years ago
mkittler wrote:
It doesn't look too bad right now. Performance is normal and htop looks normal.
Actually not fully back to "normal". https://monitor.qa.suse.de/d/WebuiDb/webui-summary?orgId=1&viewPanel=89&from=1655433966538&to=1655870624954 shows that we have improved around 2022-06-21 0830Z but we still have spikes of huge queries and also badly impacted services, e.g. failing openqa-review https://gitlab.suse.de/openqa/openqa-review/-/pipelines/418931 showing timeouts trying to read from OSD. Also https://monitor.qa.suse.de/d/WebuiDb/webui-summary?orgId=1&from=now-3h&to=now&viewPanel=78&refresh=5m shows gaps.
Updated by mkittler almost 3 years ago
It doesn't look like the number of queries of the job list route has increased:
openqa:/var/log/apache2 # for day in {13..22} ; do echo -n "202206$day: " && xzgrep -P 'GET \/api\/v1\/jobs\?.*python-requests' "access_log-202206$day.xz" | wc -l ; done
20220613: 107263
20220614: 105807
20220615: 117291
20220616: 122133
20220617: 123701
20220618: 123738
20220619: 110827
20220620: 96135
20220621: 77209
20220622: 156377
openqa:/var/log/apache2 # for day in {13..22} ; do echo -n "202206$day: " && xzgrep -P 'GET \/api\/v1\/jobs' "access_log-202206$day.xz" | wc -l ; done
20220613: 115006
20220614: 120807
20220615: 226200
20220616: 175967
20220617: 151461
20220618: 141563
20220619: 120254
20220620: 101319
20220621: 85447
20220622: 165201
openqa:/var/log/apache2 # for day in {13..22} ; do echo -n "202206$day: " && wc -l "access_log-202206$day.xz" ; done
20220613: 4577 access_log-20220613.xz
20220614: 12921 access_log-20220614.xz
20220615: 15017 access_log-20220615.xz
20220616: 14534 access_log-20220616.xz
20220617: 10396 access_log-20220617.xz
20220618: 12713 access_log-20220618.xz
20220619: 5286 access_log-20220619.xz
20220620: 4841 access_log-20220620.xz
20220621: 9561 access_log-20220621.xz
20220622: 11058 access_log-20220622.xz
Updated by tinita almost 3 years ago
The job_settings queries are still showing up as slow queries, and I analyzed one of them, it's still using a Seq Scan:
openqa=> explain analyze SELECT me.job_id, me.key, me.value FROM job_settings me WHERE ( job_id = ANY('{8997090,8997091,8997092,8997093,8997094,8997095,8997096,8997097,8997098,8997099,8997100,8997101,8997126,8997129,8997131,8997134,8997135,8997136,8997137,8997138,8997139,8997140,8997141,8997142,8997143,8997144,8997145,8997146,8997147,8997148,8997149,8997151,8997152,8997153,8997154,8997155,8997156,8997157,8997158,8997159,8997160,8997161,8997162,8997163,8997164,8997165,8997166,8997167,8997168,8997169,8997170,8997171,8997172,8997173,8997174,8997175,8997176,8997177,8997178,8997179,8997180,8997181,8997182,8997183,8997184,8997185,8997186,8997187,8997188,8997189,8997190,8997191,8997192,8997193,8997194,8997195,8997196,8997197,8997198,8997199,8997200,8997201,8997202,8997203,8997204,8997205,8997206,8997207,8997208,8997209,8997210,8997211,8997212,8997213,8997214,8997215,8997216,8997217,8997218,8997219,8997220,8997221,8997222,8997223,8997225,8997226,8997227,8997228,8997229,8997230,8997231,8997232,8997233,8997234,8997235,8997236,8997237,8997238,8997239,8997240,8997241,8997242,8997243,8997244,8997245,8997246,8997247,8997248,8997249,8997250,8997251,8997252,8997253,8997254,8997255,8997256,8997258,8997259,8997260,8997261,8997262,8997263,8997264,8997265,8997266,8997267,8997269,8997270,8997271,9003569,9003570,9004222,9004238}'));

                                                                                                          QUERY PLAN


---------------------------------------------------------------------------------------------------------------------------------------------------------------------------------------------------------------------------------------------------------------------
---------------------------------------------------------------------------------------------------------------------------------------------------------------------------------------------------------------------------------------------------------------------
---------------------------------------------------------------------------------------------------------------------------------------------------------------------------------------------------------------------------------------------------------------------
---------------------------------------------------------------------------------------------------------------------------------------------------------------------------------------------------------------------------------------------------------------------
------------------------------------------------------------------------------------------------------------------------------------------------------------------------------------------------------------------------------
 Seq Scan on job_settings me  (cost=0.38..1035661.03 rows=27195018 width=58) (actual time=11798.810..15961.629 rows=5091 loops=1)
   Filter: (job_id = ANY ('{8997090,8997091,8997092,8997093,8997094,8997095,8997096,8997097,8997098,8997099,8997100,8997101,8997126,8997129,8997131,8997134,8997135,8997136,8997137,8997138,8997139,8997140,8997141,8997142,8997143,8997144,8997145,8997146,8997147,8
997148,8997149,8997151,8997152,8997153,8997154,8997155,8997156,8997157,8997158,8997159,8997160,8997161,8997162,8997163,8997164,8997165,8997166,8997167,8997168,8997169,8997170,8997171,8997172,8997173,8997174,8997175,8997176,8997177,8997178,8997179,8997180,899718
1,8997182,8997183,8997184,8997185,8997186,8997187,8997188,8997189,8997190,8997191,8997192,8997193,8997194,8997195,8997196,8997197,8997198,8997199,8997200,8997201,8997202,8997203,8997204,8997205,8997206,8997207,8997208,8997209,8997210,8997211,8997212,8997213,899
7214,8997215,8997216,8997217,8997218,8997219,8997220,8997221,8997222,8997223,8997225,8997226,8997227,8997228,8997229,8997230,8997231,8997232,8997233,8997234,8997235,8997236,8997237,8997238,8997239,8997240,8997241,8997242,8997243,8997244,8997245,8997246,8997247,
8997248,8997249,8997250,8997251,8997252,8997253,8997254,8997255,8997256,8997258,8997259,8997260,8997261,8997262,8997263,8997264,8997265,8997266,8997267,8997269,8997270,8997271,9003569,9003570,9004222,9004238}'::bigint[]))
   Rows Removed by Filter: 35419579
 Planning Time: 0.233 ms
 JIT:
   Functions: 4
   Options: Inlining true, Optimization true, Expressions true, Deforming true
   Timing: Generation 1.506 ms, Inlining 1.499 ms, Optimization 57.674 ms, Emission 36.228 ms, Total 96.907 ms
 Execution Time: 15963.646 ms
(9 rows)
Updated by mkittler almost 3 years ago
I also enabled https://www.postgresql.org/docs/current/pgstatstatements.html on o3 to have a comparison. To revert, just remove the config at the bottom of /var/lib/pgsql/data.14/postgresql.conf again.
Updated by okurz almost 3 years ago
- Copied to action #112850: Make pgstatstatements persistent on OSD (in salt) added
Updated by mkittler almost 3 years ago
I can reproduce the seq scan locally as well:
 Gather  (cost=1000.00..5848886.39 rows=25626965 width=59) (actual time=114082.700..114087.534 rows=0 loops=1)
   Workers Planned: 2
   Workers Launched: 2
   ->  Parallel Seq Scan on job_settings me  (cost=0.00..3285189.89 rows=10677902 width=59) (actual time=114036.022..114036.023 rows=0 loops=3)
         Filter: (job_id = ANY ('{8997090,8997091,8997092,8997093,8997094,8997095,8997096,8997097,8997098,8997099,8997100,8997101,8997126,8997129,8997131,8997134,8997135,8997136,8997137,8997138,8997139,8997140,8997141,8997142,8997143,8997144,8997145,8997146,8997147,8997148,8997149,8997151,8997152,8997153,8997154,8997155,8997156,8997157,8997158,8997159,8997160,8997161,8997162,8997163,8997164,8997165,8997166,8997167,8997168,8997169,8997170,8997171,8997172,8997173,8997174,8997175,8997176,8997177,8997178,8997179,8997180,8997181,8997182,8997183,8997184,8997185,8997186,8997187,8997188,8997189,8997190,8997191,8997192,8997193,8997194,8997195,8997196,8997197,8997198,8997199,8997200,8997201,8997202,8997203,8997204,8997205,8997206,8997207,8997208,8997209,8997210,8997211,8997212,8997213,8997214,8997215,8997216,8997217,8997218,8997219,8997220,8997221,8997222,8997223,8997225,8997226,8997227,8997228,8997229,8997230,8997231,8997232,8997233,8997234,8997235,8997236,8997237,8997238,8997239,8997240,8997241,8997242,8997243,8997244,8997245,8997246,8997247,8997248,8997249,8997250,8997251,8997252,8997253,8997254,8997255,8997256,8997258,8997259,8997260,8997261,8997262,8997263,8997264,8997265,8997266,8997267,8997269,8997270,8997271,9003569,9003570,9004222,9004238}'::bigint[]))
         Rows Removed by Filter: 11166433
 Planning Time: 308.029 ms
 JIT:
   Functions: 12
   Options: Inlining true, Optimization true, Expressions true, Deforming true
   Timing: Generation 0.769 ms, Inlining 183.981 ms, Optimization 42.563 ms, Emission 33.222 ms, Total 260.535 ms
 Execution Time: 114121.038 ms
(12 Zeilen)
And the unmigrated DB uses a fast index scan instead:
 Index Scan using job_settings_idx_job_id on job_settings me  (cost=0.56..253994.17 rows=84330 width=55) (actual time=0.474..0.474 rows=0 loops=1)
   Index Cond: (job_id = ANY ('{8997090,8997091,8997092,8997093,8997094,8997095,8997096,8997097,8997098,8997099,8997100,8997101,8997126,8997129,8997131,8997134,8997135,8997136,8997137,8997138,8997139,8997140,8997141,8997142,8997143,8997144,8997145,8997146,8997147,8997148,8997149,8997151,8997152,8997153,8997154,8997155,8997156,8997157,8997158,8997159,8997160,8997161,8997162,8997163,8997164,8997165,8997166,8997167,8997168,8997169,8997170,8997171,8997172,8997173,8997174,8997175,8997176,8997177,8997178,8997179,8997180,8997181,8997182,8997183,8997184,8997185,8997186,8997187,8997188,8997189,8997190,8997191,8997192,8997193,8997194,8997195,8997196,8997197,8997198,8997199,8997200,8997201,8997202,8997203,8997204,8997205,8997206,8997207,8997208,8997209,8997210,8997211,8997212,8997213,8997214,8997215,8997216,8997217,8997218,8997219,8997220,8997221,8997222,8997223,8997225,8997226,8997227,8997228,8997229,8997230,8997231,8997232,8997233,8997234,8997235,8997236,8997237,8997238,8997239,8997240,8997241,8997242,8997243,8997244,8997245,8997246,8997247,8997248,8997249,8997250,8997251,8997252,8997253,8997254,8997255,8997256,8997258,8997259,8997260,8997261,8997262,8997263,8997264,8997265,8997266,8997267,8997269,8997270,8997271,9003569,9003570,9004222,9004238}'::integer[]))
 Planning Time: 0.401 ms
 JIT:
   Functions: 4
   Options: Inlining false, Optimization false, Expressions true, Deforming true
   Timing: Generation 0.455 ms, Inlining 0.000 ms, Optimization 0.000 ms, Emission 0.000 ms, Total 0.455 ms
 Execution Time: 1.109 ms
(8 Zeilen)
Updated by okurz almost 3 years ago
I just did vacuum ANALYZE job_settings; and then vacuum VERBOSE ANALYZE job_settings;:
INFO:  vacuuming "public.job_settings"
INFO:  table "job_settings": index scan bypassed: 2110 pages from table (0.42% of total) have 136481 dead item identifiers
INFO:  launched 0 parallel vacuum workers for index cleanup (planned: 2)
INFO:  table "job_settings": found 0 removable, 182822 nonremovable row versions in 4302 out of 502477 pages
DETAIL:  0 dead row versions cannot be removed yet, oldest xmin: 3938288861
Skipped 0 pages due to buffer pins, 0 frozen pages.
CPU: user: 0.05 s, system: 0.17 s, elapsed: 0.26 s.
INFO:  vacuuming "pg_toast.pg_toast_16513"
INFO:  table "pg_toast_16513": found 0 removable, 0 nonremovable row versions in 0 out of 0 pages
DETAIL:  0 dead row versions cannot be removed yet, oldest xmin: 3938288879
Skipped 0 pages due to buffer pins, 0 frozen pages.
CPU: user: 0.00 s, system: 0.00 s, elapsed: 0.00 s.
INFO:  analyzing "public.job_settings"
INFO:  "job_settings": scanned 30000 of 502477 pages, containing 2114703 live rows and 8429 dead rows; 30000 rows in sample, 35419654 estimated total rows
VACUUM
next vacuum VERBOSE ANALYZE job_modules;
INFO:  vacuuming "public.job_modules"
INFO:  launched 0 parallel vacuum workers for index vacuuming (planned: 2)
INFO:  scanned index "idx_job_modules_result" to remove 633279 row versions
DETAIL:  CPU: user: 1.85 s, system: 0.20 s, elapsed: 2.29 s
INFO:  scanned index "job_modules_pkey" to remove 633279 row versions
DETAIL:  CPU: user: 2.10 s, system: 0.82 s, elapsed: 3.35 s
INFO:  scanned index "job_modules_job_id_name_category_script" to remove 633279 row versions
DETAIL:  CPU: user: 3.26 s, system: 4.76 s, elapsed: 9.23 s
INFO:  scanned index "job_modules_idx_job_id" to remove 633279 row versions
DETAIL:  CPU: user: 2.17 s, system: 0.42 s, elapsed: 2.90 s
INFO:  table "job_modules": removed 633279 dead item identifiers in 25285 pages
DETAIL:  CPU: user: 0.60 s, system: 1.26 s, elapsed: 13.06 s
INFO:  index "idx_job_modules_result" now contains 29724361 row versions in 26012 pages
DETAIL:  519711 index row versions were removed.
279 index pages were newly deleted.
279 index pages are currently deleted, of which 246 are currently reusable.
CPU: user: 0.00 s, system: 0.00 s, elapsed: 0.00 s.
INFO:  index "job_modules_pkey" now contains 29724363 row versions in 82368 pages
DETAIL:  262737 index row versions were removed.
27 index pages were newly deleted.
27 index pages are currently deleted, of which 27 are currently reusable.
CPU: user: 0.00 s, system: 0.00 s, elapsed: 0.00 s.
INFO:  index "job_modules_job_id_name_category_script" now contains 29724406 row versions in 298105 pages
DETAIL:  311194 index row versions were removed.
240 index pages were newly deleted.
240 index pages are currently deleted, of which 240 are currently reusable.
CPU: user: 0.00 s, system: 0.00 s, elapsed: 0.00 s.
INFO:  index "job_modules_idx_job_id" now contains 29724407 row versions in 27920 pages
DETAIL:  363998 index row versions were removed.
32 index pages were newly deleted.
32 index pages are currently deleted, of which 32 are currently reusable.
CPU: user: 0.00 s, system: 0.00 s, elapsed: 0.00 s.
INFO:  table "job_modules": found 31717 removable, 11683779 nonremovable row versions in 202449 out of 502360 pages
DETAIL:  16 dead row versions cannot be removed yet, oldest xmin: 3938298112
Skipped 0 pages due to buffer pins, 0 frozen pages.
CPU: user: 11.99 s, system: 10.49 s, elapsed: 49.16 s.
INFO:  vacuuming "pg_toast.pg_toast_16494"
INFO:  table "pg_toast_16494": found 0 removable, 0 nonremovable row versions in 0 out of 0 pages
DETAIL:  0 dead row versions cannot be removed yet, oldest xmin: 3938302733
Skipped 0 pages due to buffer pins, 0 frozen pages.
CPU: user: 0.00 s, system: 0.00 s, elapsed: 0.00 s.
INFO:  analyzing "public.job_modules"
INFO:  "job_modules": scanned 30000 of 502360 pages, containing 1776205 live rows and 0 dead rows; 30000 rows in sample, 29743145 estimated total rows
VACUUM
and next vacuum VERBOSE ANALYZE jobs;
INFO:  vacuuming "public.jobs"
INFO:  launched 0 parallel vacuum workers for index vacuuming (planned: 2)
INFO:  scanned index "coolo_test4" to remove 99340 row versions
DETAIL:  CPU: user: 0.09 s, system: 0.02 s, elapsed: 0.34 s
INFO:  scanned index "idx_jobs_build_group" to remove 99340 row versions
DETAIL:  CPU: user: 0.06 s, system: 0.03 s, elapsed: 0.14 s
INFO:  scanned index "idx_jobs_result" to remove 99340 row versions
DETAIL:  CPU: user: 0.05 s, system: 0.00 s, elapsed: 0.08 s
INFO:  scanned index "idx_jobs_scenario" to remove 99340 row versions
DETAIL:  CPU: user: 0.09 s, system: 0.03 s, elapsed: 0.19 s
INFO:  scanned index "idx_jobs_state" to remove 99340 row versions
DETAIL:  CPU: user: 0.04 s, system: 0.01 s, elapsed: 0.09 s
INFO:  scanned index "jobs_idx_group_id" to remove 99340 row versions
DETAIL:  CPU: user: 0.08 s, system: 0.05 s, elapsed: 0.18 s
INFO:  scanned index "jobs_idx_scheduled_product_id" to remove 99340 row versions
DETAIL:  CPU: user: 0.07 s, system: 0.02 s, elapsed: 0.14 s
INFO:  scanned index "jobs_pkey" to remove 99340 row versions
DETAIL:  CPU: user: 0.07 s, system: 0.02 s, elapsed: 0.14 s
INFO:  scanned index "jobs_idx_clone_id" to remove 99340 row versions
DETAIL:  CPU: user: 0.06 s, system: 0.03 s, elapsed: 0.13 s
INFO:  scanned index "jobs_idx_blocked_by_id" to remove 99340 row versions
DETAIL:  CPU: user: 0.06 s, system: 0.02 s, elapsed: 0.11 s
INFO:  scanned index "jobs_idx_assigned_worker_id" to remove 99340 row versions
DETAIL:  CPU: user: 0.07 s, system: 0.01 s, elapsed: 0.13 s
INFO:  table "jobs": removed 99340 dead item identifiers in 27551 pages
DETAIL:  CPU: user: 0.14 s, system: 0.00 s, elapsed: 0.20 s
INFO:  index "coolo_test4" now contains 661965 row versions in 2027 pages
DETAIL:  81238 index row versions were removed.
6 index pages were newly deleted.
10 index pages are currently deleted, of which 7 are currently reusable.
CPU: user: 0.00 s, system: 0.00 s, elapsed: 0.00 s.
INFO:  index "idx_jobs_build_group" now contains 661965 row versions in 1204 pages
DETAIL:  77046 index row versions were removed.
6 index pages were newly deleted.
7 index pages are currently deleted, of which 2 are currently reusable.
CPU: user: 0.00 s, system: 0.00 s, elapsed: 0.00 s.
INFO:  index "idx_jobs_result" now contains 661965 row versions in 753 pages
DETAIL:  86928 index row versions were removed.
23 index pages were newly deleted.
44 index pages are currently deleted, of which 36 are currently reusable.
CPU: user: 0.00 s, system: 0.00 s, elapsed: 0.00 s.
INFO:  index "idx_jobs_scenario" now contains 661965 row versions in 1607 pages
DETAIL:  77907 index row versions were removed.
2 index pages were newly deleted.
2 index pages are currently deleted, of which 0 are currently reusable.
CPU: user: 0.00 s, system: 0.00 s, elapsed: 0.00 s.
INFO:  index "idx_jobs_state" now contains 661965 row versions in 758 pages
DETAIL:  81137 index row versions were removed.
81 index pages were newly deleted.
128 index pages are currently deleted, of which 86 are currently reusable.
CPU: user: 0.00 s, system: 0.00 s, elapsed: 0.00 s.
INFO:  index "jobs_idx_group_id" now contains 661965 row versions in 985 pages
DETAIL:  84647 index row versions were removed.
3 index pages were newly deleted.
3 index pages are currently deleted, of which 1 are currently reusable.
CPU: user: 0.00 s, system: 0.00 s, elapsed: 0.00 s.
INFO:  index "jobs_idx_scheduled_product_id" now contains 661965 row versions in 1143 pages
DETAIL:  85980 index row versions were removed.
4 index pages were newly deleted.
4 index pages are currently deleted, of which 2 are currently reusable.
CPU: user: 0.00 s, system: 0.00 s, elapsed: 0.00 s.
INFO:  index "jobs_pkey" now contains 661965 row versions in 2083 pages
DETAIL:  43189 index row versions were removed.
0 index pages were newly deleted.
0 index pages are currently deleted, of which 0 are currently reusable.
CPU: user: 0.00 s, system: 0.00 s, elapsed: 0.00 s.
INFO:  index "jobs_idx_clone_id" now contains 661965 row versions in 1023 pages
DETAIL:  86744 index row versions were removed.
0 index pages were newly deleted.
0 index pages are currently deleted, of which 0 are currently reusable.
CPU: user: 0.00 s, system: 0.00 s, elapsed: 0.00 s.
INFO:  index "jobs_idx_blocked_by_id" now contains 661965 row versions in 772 pages
DETAIL:  86392 index row versions were removed.
1 index pages were newly deleted.
1 index pages are currently deleted, of which 1 are currently reusable.
CPU: user: 0.00 s, system: 0.00 s, elapsed: 0.00 s.
INFO:  index "jobs_idx_assigned_worker_id" now contains 661965 row versions in 1056 pages
DETAIL:  92761 index row versions were removed.
6 index pages were newly deleted.
6 index pages are currently deleted, of which 1 are currently reusable.
CPU: user: 0.00 s, system: 0.00 s, elapsed: 0.00 s.
INFO:  table "jobs": found 8522 removable, 502320 nonremovable row versions in 45212 out of 54359 pages
DETAIL:  12 dead row versions cannot be removed yet, oldest xmin: 3938303259
Skipped 0 pages due to buffer pins, 2478 frozen pages.
CPU: user: 1.08 s, system: 0.43 s, elapsed: 2.41 s.
INFO:  vacuuming "pg_toast.pg_toast_16534"
INFO:  table "pg_toast_16534": found 0 removable, 0 nonremovable row versions in 0 out of 0 pages
DETAIL:  0 dead row versions cannot be removed yet, oldest xmin: 3938303460
Skipped 0 pages due to buffer pins, 0 frozen pages.
CPU: user: 0.00 s, system: 0.00 s, elapsed: 0.00 s.
INFO:  analyzing "public.jobs"
INFO:  "jobs": scanned 30000 of 54359 pages, containing 365019 live rows and 0 dead rows; 30000 rows in sample, 661402 estimated total rows
VACUUM
tinita and kraih have analyzed queries and could see that the queries are conducted using an optimal route and utilizing indices. Let's see if any of the next spikes in https://monitor.qa.suse.de/d/WebuiDb/webui-summary?orgId=1&viewPanel=89&from=1655809908704&to=1655841028082 will look different. At 0944Z we saw a spike but it was much lower so it seems the vacuum ANALYZE helped. The current hypothesis is that the migration to "bigint" would have triggered a query planner update causing to end up with sub-optimal routing. As also auto-vacuum is eventually triggering "ANALYZE" we assume that eventually the system would recover automatically by using optimized queries. This is likely what happened on o3 after the period of 1-2 days. On OSD we do not have enough performance headroom (in particular CPU and potentially disk I/O) to cover for such periods.
Updated by livdywan almost 3 years ago
I updated /srv/PSQL/data/postgresql.conf again to increase the postgres workers:
max_worker_processes = 8
Let's see what effect this has. Ideally it will improve performance but I don't think this was evaluated recently. I'm leaving "parallel" workers on 0 for now since that can increase the cpu load 5-fold as per documentation (I'd still test this out separately later).
Updated by okurz almost 3 years ago
A fun quote from kraih: "my postgres friend says query planner getting stuck on doing sequential scans after a big migration is something that happens, manual vacuum analyze is the right solution" :)
EDIT: So I added an according suggestion to the original PR migrating the jobs table for others to read.
Updated by tinita almost 3 years ago
- File vaccuum-analyze-o3.txt vaccuum-analyze-o3.txt added
For the record: I did VACUUM ANALYZE on all o3 tables which have a job_id column (plus the jobs table itself).
Attached is the output for that.
The statistics for postgresql rows are already looking better, will post a munin screenshot later today.
Updated by kraih almost 3 years ago
I just did a vacuum verbose analyze on the OSD tables jobs, job_dependencies, assets, jobs_assets after checking the current top 10 slowest queries.
openqa=# vacuum verbose analyze jobs_assets;
INFO:  vacuuming "public.jobs_assets"
INFO:  launched 0 parallel vacuum workers for index vacuuming (planned: 2)
INFO:  scanned index "jobs_assets_idx_job_id" to remove 15264 row versions
DETAIL:  CPU: user: 0.16 s, system: 0.04 s, elapsed: 0.36 s
INFO:  scanned index "jobs_assets_job_id_asset_id" to remove 15264 row versions
DETAIL:  CPU: user: 0.16 s, system: 0.08 s, elapsed: 0.36 s
INFO:  scanned index "jobs_assets_idx_asset_id" to remove 15264 row versions
DETAIL:  CPU: user: 0.20 s, system: 0.02 s, elapsed: 0.30 s
INFO:  table "jobs_assets": removed 15264 dead item identifiers in 2883 pages
DETAIL:  CPU: user: 0.05 s, system: 0.00 s, elapsed: 0.06 s
INFO:  index "jobs_assets_idx_job_id" now contains 2669580 row versions in 3853 pages
DETAIL:  15264 index row versions were removed.
4 index pages were newly deleted.
4 index pages are currently deleted, of which 0 are currently reusable.
CPU: user: 0.00 s, system: 0.00 s, elapsed: 0.00 s.
INFO:  index "jobs_assets_job_id_asset_id" now contains 2669580 row versions in 10366 pages
DETAIL:  15264 index row versions were removed.
9 index pages were newly deleted.
9 index pages are currently deleted, of which 0 are currently reusable.
CPU: user: 0.00 s, system: 0.00 s, elapsed: 0.00 s.
INFO:  index "jobs_assets_idx_asset_id" now contains 2669580 row versions in 2527 pages
DETAIL:  15264 index row versions were removed.
0 index pages were newly deleted.
0 index pages are currently deleted, of which 0 are currently reusable.
CPU: user: 0.00 s, system: 0.00 s, elapsed: 0.00 s.
INFO:  table "jobs_assets": found 5383 removable, 2669580 nonremovable row versions in 22882 out of 22882 pages
DETAIL:  0 dead row versions cannot be removed yet, oldest xmin: 3939774158
Skipped 0 pages due to buffer pins, 0 frozen pages.
CPU: user: 0.88 s, system: 0.25 s, elapsed: 1.57 s.
INFO:  analyzing "public.jobs_assets"
INFO:  "jobs_assets": scanned 22882 of 22882 pages, containing 2669580 live rows and 0 dead rows; 30000 rows in sample, 2669580 estimated total rows
VACUUM
openqa=# vacuum verbose analyze assets;
INFO:  vacuuming "public.assets"
INFO:  launched 0 parallel vacuum workers for index vacuuming (planned: 2)
INFO:  scanned index "assets_type_name" to remove 3944 row versions
DETAIL:  CPU: user: 0.01 s, system: 0.01 s, elapsed: 0.08 s
INFO:  scanned index "assets_pkey" to remove 3944 row versions
DETAIL:  CPU: user: 0.01 s, system: 0.00 s, elapsed: 0.02 s
INFO:  scanned index "assets_idx_last_use_job_id" to remove 3944 row versions
DETAIL:  CPU: user: 0.00 s, system: 0.01 s, elapsed: 0.02 s
INFO:  table "assets": removed 3944 dead item identifiers in 703 pages
DETAIL:  CPU: user: 0.00 s, system: 0.00 s, elapsed: 0.01 s
INFO:  index "assets_type_name" now contains 75237 row versions in 684 pages
DETAIL:  3868 index row versions were removed.
0 index pages were newly deleted.
0 index pages are currently deleted, of which 0 are currently reusable.
CPU: user: 0.00 s, system: 0.00 s, elapsed: 0.00 s.
INFO:  index "assets_pkey" now contains 75237 row versions in 221 pages
DETAIL:  3836 index row versions were removed.
0 index pages were newly deleted.
0 index pages are currently deleted, of which 0 are currently reusable.
CPU: user: 0.00 s, system: 0.00 s, elapsed: 0.00 s.
INFO:  index "assets_idx_last_use_job_id" now contains 75237 row versions in 204 pages
DETAIL:  3928 index row versions were removed.
0 index pages were newly deleted.
0 index pages are currently deleted, of which 0 are currently reusable.
CPU: user: 0.00 s, system: 0.00 s, elapsed: 0.00 s.
INFO:  table "assets": found 1168 removable, 75237 nonremovable row versions in 1377 out of 1377 pages
DETAIL:  0 dead row versions cannot be removed yet, oldest xmin: 3939775569
Skipped 0 pages due to buffer pins, 0 frozen pages.
CPU: user: 0.05 s, system: 0.03 s, elapsed: 0.17 s.
INFO:  vacuuming "pg_toast.pg_toast_16407"
INFO:  table "pg_toast_16407": found 0 removable, 0 nonremovable row versions in 0 out of 0 pages
DETAIL:  0 dead row versions cannot be removed yet, oldest xmin: 3939775595
Skipped 0 pages due to buffer pins, 0 frozen pages.
CPU: user: 0.00 s, system: 0.00 s, elapsed: 0.00 s.
INFO:  analyzing "public.assets"
INFO:  "assets": scanned 1377 of 1377 pages, containing 75237 live rows and 0 dead rows; 30000 rows in sample, 75237 estimated total rows
VACUUM
openqa=# vacuum verbose analyze job_dependencies;
INFO:  vacuuming "public.job_dependencies"
INFO:  table "job_dependencies": index scan bypassed: 49 pages from table (1.67% of total) have 1318 dead item identifiers
INFO:  launched 0 parallel vacuum workers for index cleanup (planned: 2)
INFO:  table "job_dependencies": found 1079 removable, 442956 nonremovable row versions in 2933 out of 2933 pages
DETAIL:  0 dead row versions cannot be removed yet, oldest xmin: 3939776975
Skipped 0 pages due to buffer pins, 0 frozen pages.
CPU: user: 0.04 s, system: 0.01 s, elapsed: 0.06 s.
INFO:  analyzing "public.job_dependencies"
INFO:  "job_dependencies": scanned 2933 of 2933 pages, containing 442956 live rows and 1318 dead rows; 30000 rows in sample, 442956 estimated total rows
VACUUM
openqa=# vacuum verbose analyze jobs;
INFO:  vacuuming "public.jobs"
INFO:  launched 0 parallel vacuum workers for index vacuuming (planned: 2)
INFO:  scanned index "coolo_test4" to remove 17630 row versions
DETAIL:  CPU: user: 0.07 s, system: 0.00 s, elapsed: 0.11 s
INFO:  scanned index "idx_jobs_build_group" to remove 17630 row versions
DETAIL:  CPU: user: 0.05 s, system: 0.00 s, elapsed: 0.09 s
INFO:  scanned index "idx_jobs_result" to remove 17630 row versions
DETAIL:  CPU: user: 0.03 s, system: 0.00 s, elapsed: 0.06 s
INFO:  scanned index "idx_jobs_scenario" to remove 17630 row versions
DETAIL:  CPU: user: 0.07 s, system: 0.00 s, elapsed: 0.08 s
INFO:  scanned index "idx_jobs_state" to remove 17630 row versions
DETAIL:  CPU: user: 0.03 s, system: 0.00 s, elapsed: 0.05 s
INFO:  scanned index "jobs_idx_group_id" to remove 17630 row versions
DETAIL:  CPU: user: 0.04 s, system: 0.00 s, elapsed: 0.08 s
INFO:  scanned index "jobs_idx_scheduled_product_id" to remove 17630 row versions
DETAIL:  CPU: user: 0.05 s, system: 0.01 s, elapsed: 0.10 s
INFO:  scanned index "jobs_pkey" to remove 17630 row versions
DETAIL:  CPU: user: 0.05 s, system: 0.00 s, elapsed: 0.07 s
INFO:  scanned index "jobs_idx_clone_id" to remove 17630 row versions
DETAIL:  CPU: user: 0.04 s, system: 0.03 s, elapsed: 0.12 s
INFO:  scanned index "jobs_idx_blocked_by_id" to remove 17630 row versions
DETAIL:  CPU: user: 0.03 s, system: 0.02 s, elapsed: 0.09 s
INFO:  scanned index "jobs_idx_assigned_worker_id" to remove 17630 row versions
DETAIL:  CPU: user: 0.05 s, system: 0.00 s, elapsed: 0.09 s
INFO:  table "jobs": removed 17630 dead item identifiers in 5316 pages
DETAIL:  CPU: user: 0.03 s, system: 0.00 s, elapsed: 0.03 s
INFO:  index "coolo_test4" now contains 662455 row versions in 2027 pages
DETAIL:  12785 index row versions were removed.
0 index pages were newly deleted.
7 index pages are currently deleted, of which 7 are currently reusable.
CPU: user: 0.00 s, system: 0.00 s, elapsed: 0.00 s.
INFO:  index "idx_jobs_build_group" now contains 662455 row versions in 1208 pages
DETAIL:  13102 index row versions were removed.
0 index pages were newly deleted.
5 index pages are currently deleted, of which 5 are currently reusable.
CPU: user: 0.00 s, system: 0.00 s, elapsed: 0.00 s.
INFO:  index "idx_jobs_result" now contains 662455 row versions in 753 pages
DETAIL:  15598 index row versions were removed.
18 index pages were newly deleted.
62 index pages are currently deleted, of which 45 are currently reusable.
CPU: user: 0.00 s, system: 0.00 s, elapsed: 0.00 s.
INFO:  index "idx_jobs_scenario" now contains 662455 row versions in 1613 pages
DETAIL:  10890 index row versions were removed.
0 index pages were newly deleted.
2 index pages are currently deleted, of which 2 are currently reusable.
CPU: user: 0.00 s, system: 0.00 s, elapsed: 0.00 s.
INFO:  index "idx_jobs_state" now contains 662455 row versions in 758 pages
DETAIL:  8341 index row versions were removed.
28 index pages were newly deleted.
148 index pages are currently deleted, of which 120 are currently reusable.
CPU: user: 0.00 s, system: 0.00 s, elapsed: 0.00 s.
INFO:  index "jobs_idx_group_id" now contains 662455 row versions in 996 pages
DETAIL:  14724 index row versions were removed.
0 index pages were newly deleted.
2 index pages are currently deleted, of which 2 are currently reusable.
CPU: user: 0.00 s, system: 0.00 s, elapsed: 0.00 s.
INFO:  index "jobs_idx_scheduled_product_id" now contains 662455 row versions in 1143 pages
DETAIL:  14698 index row versions were removed.
0 index pages were newly deleted.
2 index pages are currently deleted, of which 2 are currently reusable.
CPU: user: 0.00 s, system: 0.00 s, elapsed: 0.00 s.
INFO:  index "jobs_pkey" now contains 662455 row versions in 2088 pages
DETAIL:  5720 index row versions were removed.
0 index pages were newly deleted.
0 index pages are currently deleted, of which 0 are currently reusable.
CPU: user: 0.00 s, system: 0.00 s, elapsed: 0.00 s.
INFO:  index "jobs_idx_clone_id" now contains 662455 row versions in 1024 pages
DETAIL:  16479 index row versions were removed.
0 index pages were newly deleted.
0 index pages are currently deleted, of which 0 are currently reusable.
CPU: user: 0.00 s, system: 0.00 s, elapsed: 0.00 s.
INFO:  index "jobs_idx_blocked_by_id" now contains 662455 row versions in 772 pages
DETAIL:  16040 index row versions were removed.
0 index pages were newly deleted.
1 index pages are currently deleted, of which 1 are currently reusable.
CPU: user: 0.00 s, system: 0.00 s, elapsed: 0.00 s.
INFO:  index "jobs_idx_assigned_worker_id" now contains 662455 row versions in 1056 pages
DETAIL:  16756 index row versions were removed.
0 index pages were newly deleted.
5 index pages are currently deleted, of which 5 are currently reusable.
CPU: user: 0.00 s, system: 0.00 s, elapsed: 0.00 s.
INFO:  table "jobs": found 5235 removable, 353950 nonremovable row versions in 19562 out of 54359 pages
DETAIL:  3 dead row versions cannot be removed yet, oldest xmin: 3939780595
Skipped 0 pages due to buffer pins, 16728 frozen pages.
CPU: user: 0.68 s, system: 0.28 s, elapsed: 1.28 s.
INFO:  table "jobs": truncated 54359 to 54342 pages
DETAIL:  CPU: user: 0.00 s, system: 0.00 s, elapsed: 0.02 s
INFO:  vacuuming "pg_toast.pg_toast_16534"
INFO:  table "pg_toast_16534": found 0 removable, 0 nonremovable row versions in 0 out of 0 pages
DETAIL:  0 dead row versions cannot be removed yet, oldest xmin: 3939780633
Skipped 0 pages due to buffer pins, 0 frozen pages.
CPU: user: 0.00 s, system: 0.00 s, elapsed: 0.00 s.
INFO:  analyzing "public.jobs"
INFO:  "jobs": scanned 30000 of 54342 pages, containing 365715 live rows and 21 dead rows; 30000 rows in sample, 662456 estimated total rows
VACUUM
Updated by okurz almost 3 years ago
Created https://gitlab.suse.de/openqa/salt-states-openqa/-/merge_requests/703 to make the psql work mem config change persistent.
Updated by okurz almost 3 years ago
- Description updated (diff)
- openQA scheduler is fine since last day
- Retriggered again a
for i in incomplete timeout_exceeded ; do host=openqa.suse.de failed_since=2022-06-20 result="result='$i'" openqa-advanced-retrigger-jobs ; done. - More rollbacks, updated description
- Monitoring while waiting for https://gitlab.suse.de/openqa/salt-states-openqa/-/merge_requests/703
Updated by tinita almost 3 years ago
- File o3-munin-pg-rows.png o3-munin-pg-rows.png added
Screenshot of o3 postgres rows
Updated by tinita almost 3 years ago
- File vaccuum-analyze-osd.txt vaccuum-analyze-osd.txt added
I also analyzed the remaining tables on osd which reference job_id.
I don't see any difference in the rows statistics, though.
Updated by openqa_review almost 3 years ago
Setting due date based on mean cycle time of SUSE QE Tools
Updated by okurz almost 3 years ago
- File postgres_queries3_openqa-week.png postgres_queries3_openqa-week.png added
- File Screenshot_20220623_081721_osd_spotty_http_response.png Screenshot_20220623_081721_osd_spotty_http_response.png added
- File Screenshot_20220623_082117_increase_in_rows_returned_after_bigint_migration.png Screenshot_20220623_082117_increase_in_rows_returned_after_bigint_migration.png added
- File Screenshot_20220623_082633_different_mitigations_to_OSD_incident.png Screenshot_20220623_082633_different_mitigations_to_OSD_incident.png added
- Tracker changed from action to coordination
Preparing some pictures to archive:
- Original problem visible, reduced responsiveness after deploying gh#os-autoinst/openQA#4701:
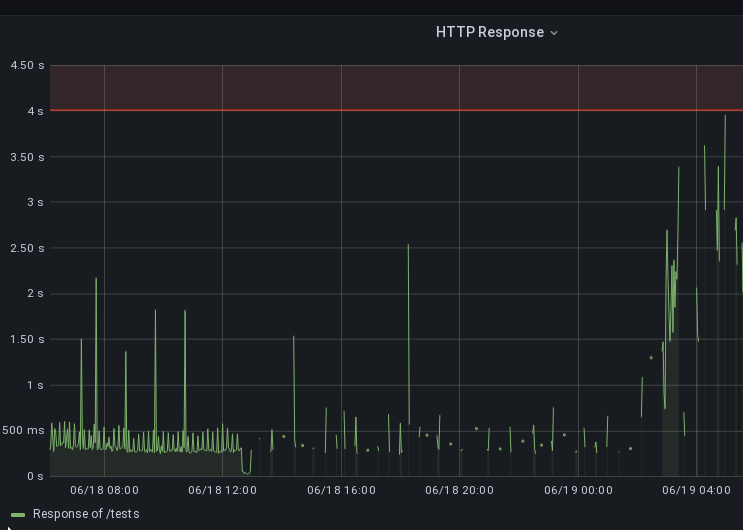
- Increase in rows returned after bigint migration explaining the overload
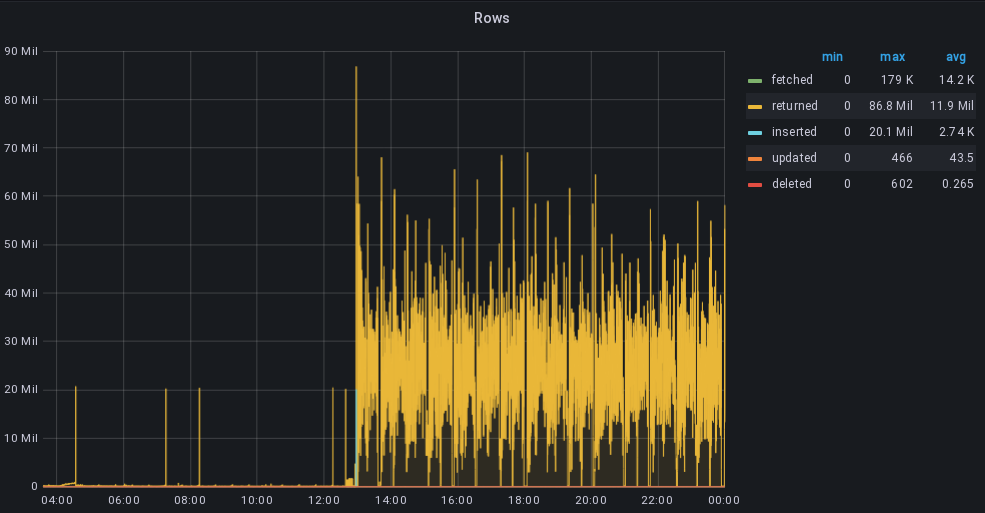
- Equivalent observation in o3 with no external influence
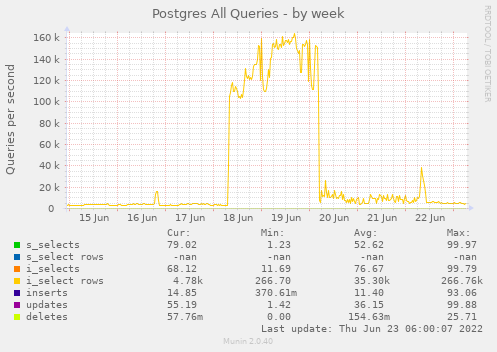
- Different mitigations and their effects on database rows
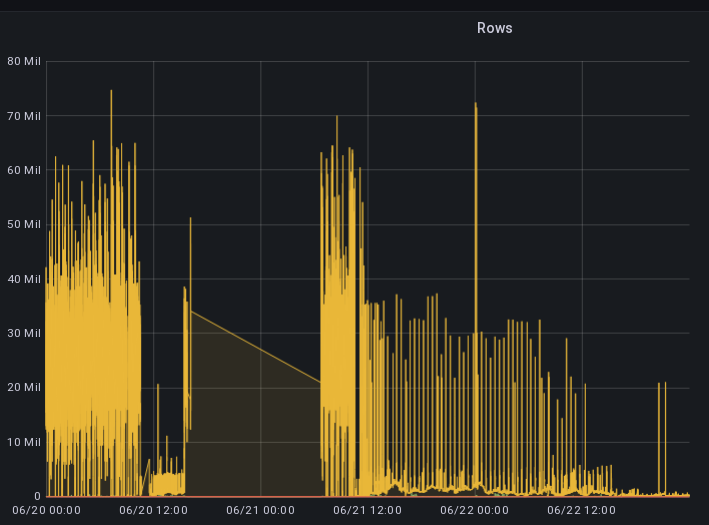
Updated by livdywan almost 3 years ago
- Copied to action #112916: postgresql.conf is invalid after recent salt changes size:M added
Updated by livdywan almost 3 years ago
The parallel workers setting was reset to the default again. Ideally it should make no difference.
Updated by okurz almost 3 years ago
- Related to coordination #99549: [epic] Split production workload onto multiple hosts (focusing on OSD) added
Updated by okurz almost 3 years ago
- Related to action #94705: Monitor number of SQL queries in grafana added
Updated by okurz over 2 years ago
- Related to action #116722: openqa.suse.de is not reachable 2022-09-18, no ping response, postgreSQL OOM and kernel panics size:M added