action #107875
closed[alert][osd] Apache Response Time alert size:M
0%
Description
Observation
We've got the alert again on March 3, 2022 09:00:40:
[Alerting] Apache Response Time alert
The apache response time exceeded the alert threshold. * Check the load of the web UI host * Consider restarting the openQA web UI service and/or apache Also see https://progress.opensuse.org/issues/73633

Metric name
Value
Min
18733128.83
Relevant panel: https://stats.openqa-monitor.qa.suse.de/d/WebuiDb/webui-summary?tab=alert&viewPanel=84
Tina wrote in chat
if anyone was wondering about the short high load on osd, I fetched /api/v1/jobs and it took 10 minutes
but that was already on Wednesday so it shouldn't have been caused this.
Further data points
- High CPU likely didn't affect scheduling, or we should've had other reports of it
- High CPU wouldn't cause a spike in failures in jobs?
Suggestions
- The apache log parsing seems to be quite heavy. Can we reduce the amount of data parsed by telegraf
- Reduce interval we take new data points in telegraf
- Extend alerting measurement period from 5m to 30m (or higher) to smooth out gaps
Files
Updated by tinita about 3 years ago
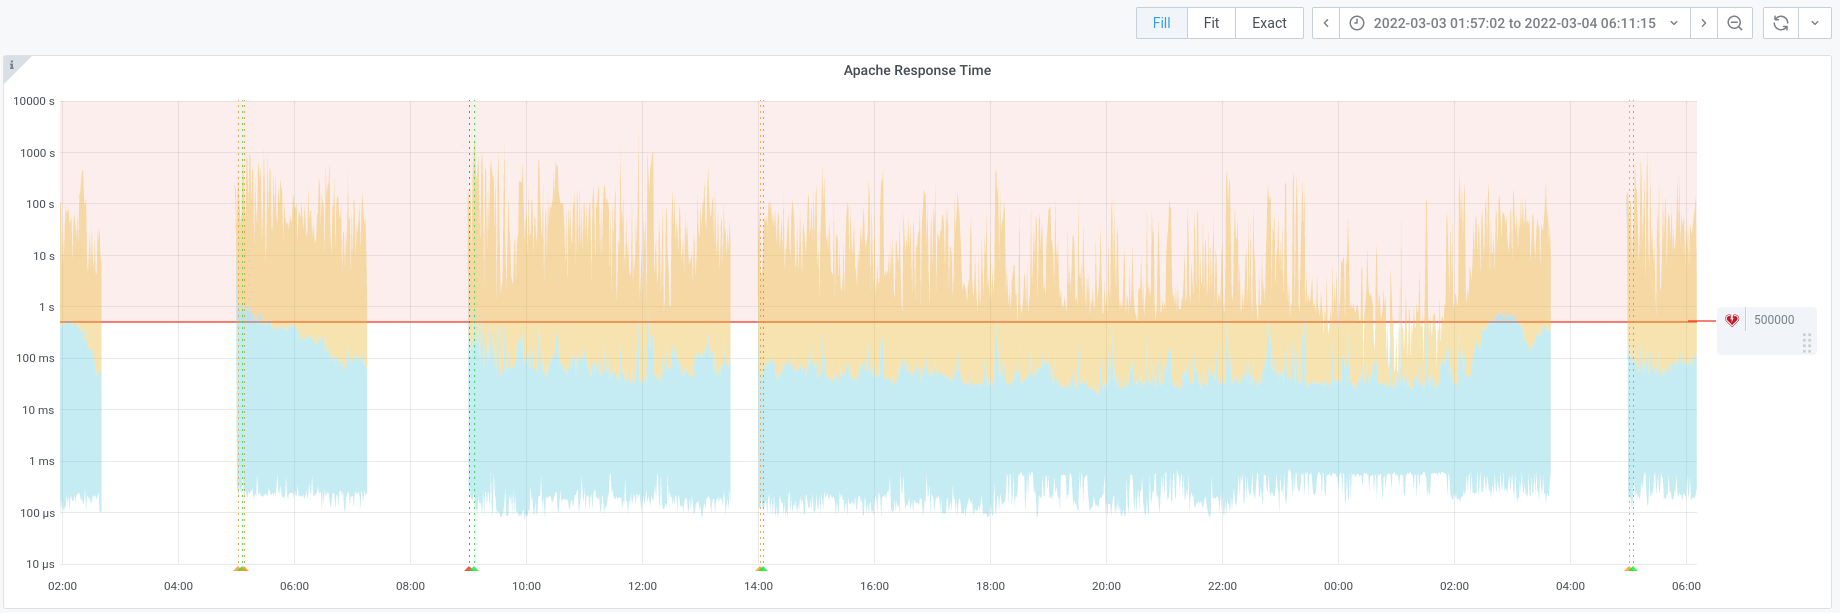
To me it looks like it was caused by data gaps again:
https://stats.openqa-monitor.qa.suse.de/d/WebuiDb/webui-summary?orgId=1&tab=alert&viewPanel=84&from=1646285146518&to=1646301111736
Updated by mkittler about 3 years ago
- File screenshot_20220304_160005.png screenshot_20220304_160005.png added
- File screenshot_20220304_160755.png screenshot_20220304_160755.png added
- File screenshot_20220304_160913.png screenshot_20220304_160913.png added
I've also just had a look. The InfluxDB query is very slot when selecting a time-range like "Last 2 days". Maybe we're collecting too many data points per time. Regardless, it looks like gaps causing this, indeed:
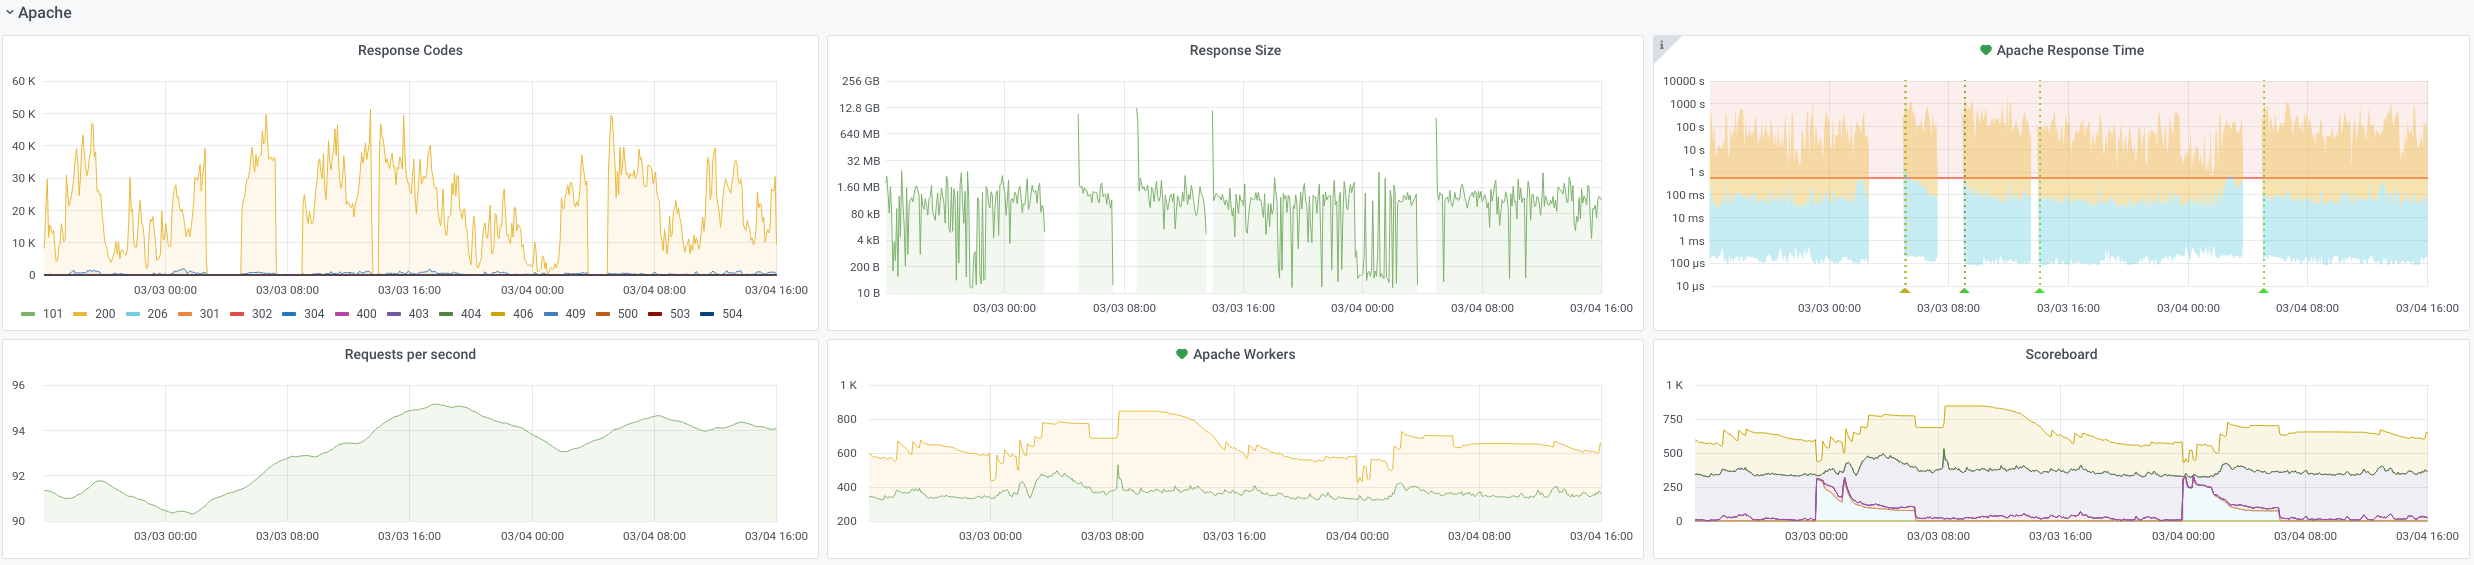
Some other graphs have gaps as well but not all:
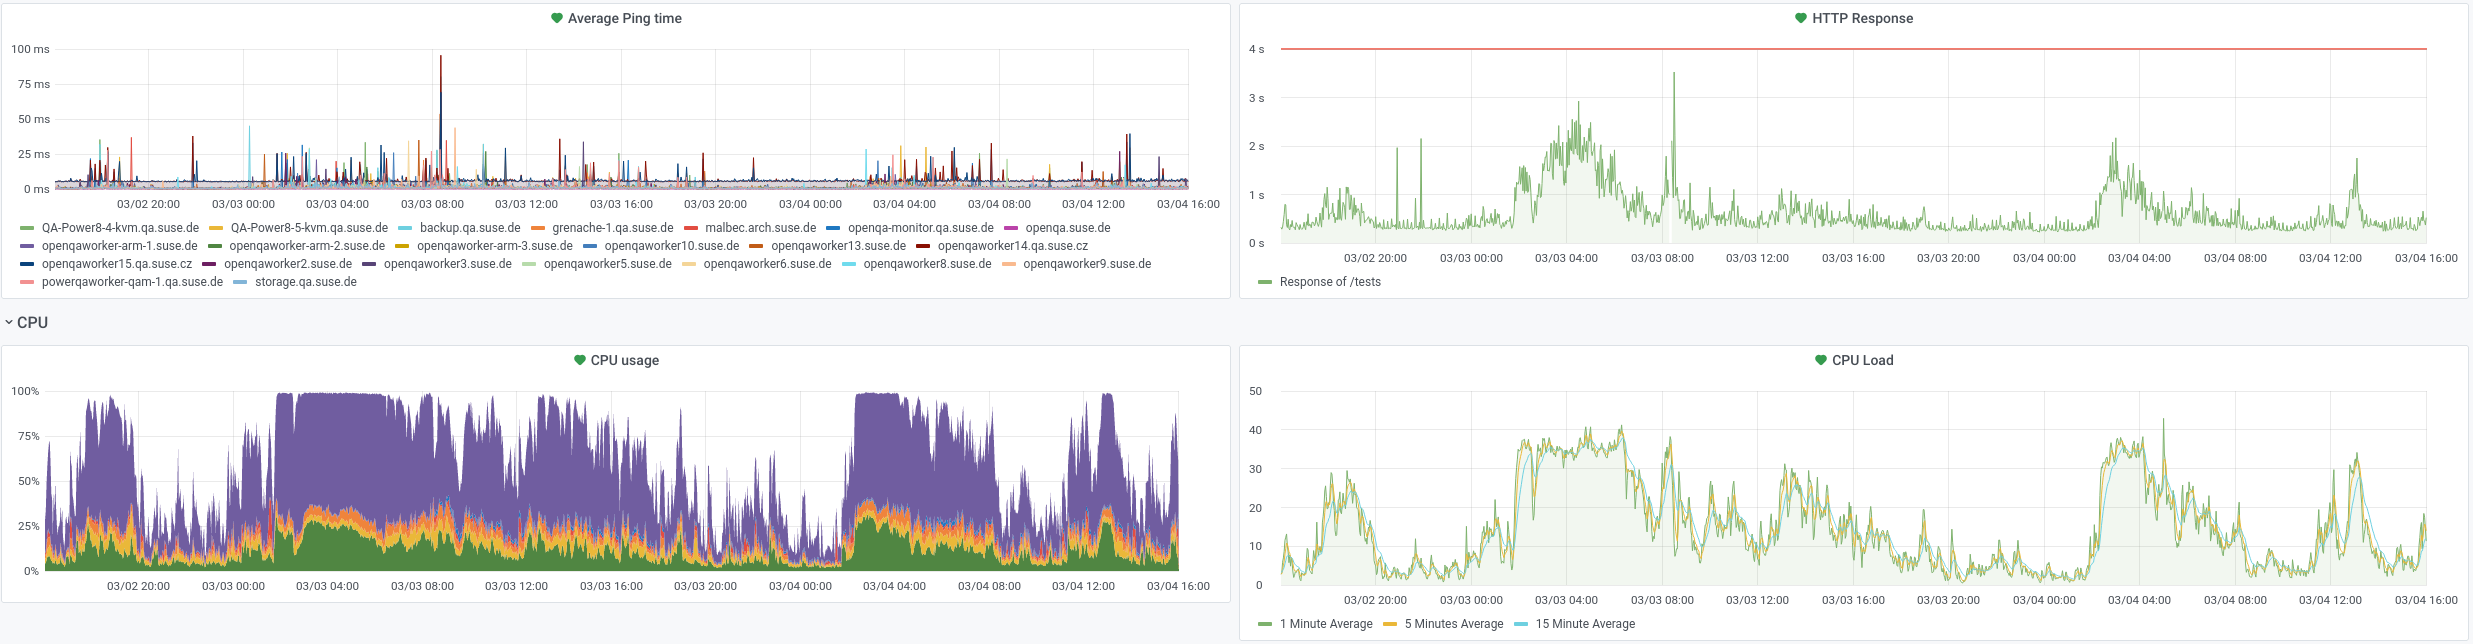
The CPU load was quite high from time to time but the HTTP response graph shows no gaps:
Updated by okurz about 3 years ago
- Related to action #107257: [alert][osd] Apache Response Time alert size:M added
Updated by okurz about 3 years ago
- Related to action #96807: Web UI is slow and Apache Response Time alert got triggered added
Updated by livdywan about 3 years ago
- Subject changed from [alert][osd] Apache Response Time alert to [alert][osd] Apache Response Time alert size:M
- Description updated (diff)
- Status changed from New to Workable
- Assignee set to tinita
Updated by okurz about 3 years ago
- Status changed from Workable to In Progress
@tinita I have an idea regarding the apache response alert ticket after looking at the graph. I prepared an MR for the dashboard
https://gitlab.suse.de/openqa/salt-states-openqa/-/merge_requests/662
You could look into the apache logs parsing from telegraf.
Updated by tinita about 3 years ago
All graphs with gaps are reading from the apache_log table, but the comment Response time measured by the apache proxy [...] suggests that this data comes from the proxy logs and not from apache itself.
I need to find out where to find the proxy and the logs.
Updated by okurz about 3 years ago
tinita wrote:
All graphs with gaps are reading from the apache_log table, but the comment
Response time measured by the apache proxy [...]suggests that this data comes from the proxy logs and not from apache itself.I need to find out where to find the proxy and the logs.
We use apache as the reverse proxy for openQA, so apache == proxy.
Updated by tinita about 3 years ago
Created https://gitlab.suse.de/openqa/salt-states-openqa/-/merge_requests/664 to replace logparser with tail
Updated by openqa_review about 3 years ago
- Due date set to 2022-03-24
Setting due date based on mean cycle time of SUSE QE Tools
Updated by okurz about 3 years ago
- Copied to coordination #108209: [epic] Reduce load on OSD added
Updated by okurz about 3 years ago
In the weekly we extracted #108209 into a separate ticket, so all mid- and long-term ideas should go into there. Here we should really focus on short-term mitigations avoiding alerts when our system is still operable (under the known constraints).
@tinita try out different log parsing intervals in the telegraf config for apache logs and monitor if the alert still triggers. Maybe https://gitlab.suse.de/openqa/salt-states-openqa/-/merge_requests/662 and https://gitlab.suse.de/openqa/salt-states-openqa/-/merge_requests/664 are already enough.
Updated by tinita about 3 years ago
Increase the interval for tail: https://gitlab.suse.de/openqa/salt-states-openqa/-/merge_requests/665
Updated by tinita about 3 years ago
- Status changed from In Progress to Feedback
Updated by tinita about 3 years ago
- Status changed from Feedback to Resolved
So even after the interval change to 30s was merged, we still have gaps (there was a one hour gap this morning, in the middle of a 3 hour timeframe with high load).
But we haven't seen alerts, so I consider this ticket resolved, as we have a followup ticket about the high load.
Updated by tinita about 3 years ago
Just out of curiosity I created a grafana dashboard, btw: https://monitor.qa.suse.de/d/1pHb56Lnk/tinas-dashboard which can be interesting to see which type of requests we have and which useragents.
Updated by okurz about 3 years ago
- Related to action #94111: Optimize /api/v1/jobs added
Updated by okurz about 2 years ago
- Related to action #128789: [alert] Apache Response Time alert size:M added