action #95293
closedMonitoring alerts on errors in logs on o3 (was: followup to: error on "Next & previous results": ajax error message and no results showing up) size:M
0%
Description
Observation
From favogt:
I'm getting a 500 on https://openqa.opensuse.org/tests/1831535#next_previous due to [2021-07-09T09:20:25.0092 UTC] [error] [sNVmMoPb-wu6] Can't call method "id" on an undefined value at /usr/share/openqa/script/../lib/OpenQA/WebAPI/Controller/Test.pm line 119.. Known?
The problem has been fixed with a revert in #95281 but why did we not catch this issue in our tests or monitoring?
Acceptance criteria
- AC1: DONE: Tests within https://github.com/os-autoinst/openQA/ reproduce/cover the problem -> already covered in https://github.com/os-autoinst/openQA/pull/4035
- AC2: Monitoring alerts on errors in logs on o3
Suggestions
Consider using again https://github.com/os-autoinst/openqa-logwarn on o3 as we had some years ago with email sending to o3-admins@suse.de by cron jobs
Files
| coverage-after.png (86.7 KB) coverage-after.png | |||
| coverage-before.png (85.6 KB) coverage-before.png |
Updated by okurz almost 4 years ago
- Copied from action #95281: error on "Next & previous results": ajax error message and no results showing up added
Updated by tinita almost 4 years ago
why did we not catch this issue in our tests [...]?
We didn't catch it in our tests because the tests didn't have a bugref comments without a corresponding entry in the Bugs table.
Updated by ilausuch almost 4 years ago
- Subject changed from followup to: error on "Next & previous results": ajax error message and no results showing up to followup to: error on "Next & previous results": ajax error message and no results showing up size:M
- Description updated (diff)
- Status changed from New to Workable
Updated by mkittler almost 4 years ago
- Description updated (diff)
Judging by #95281#note-8 I would assume this is fixed. It would still make sense to add checks within our monitoring for errors like Can't call method ".*" on an undefined.
Updated by mkittler almost 4 years ago
- Description updated (diff)
I had an old version of the ticket open.
Updated by tinita almost 4 years ago
- File coverage-after.png coverage-after.png added
- File coverage-before.png coverage-before.png added
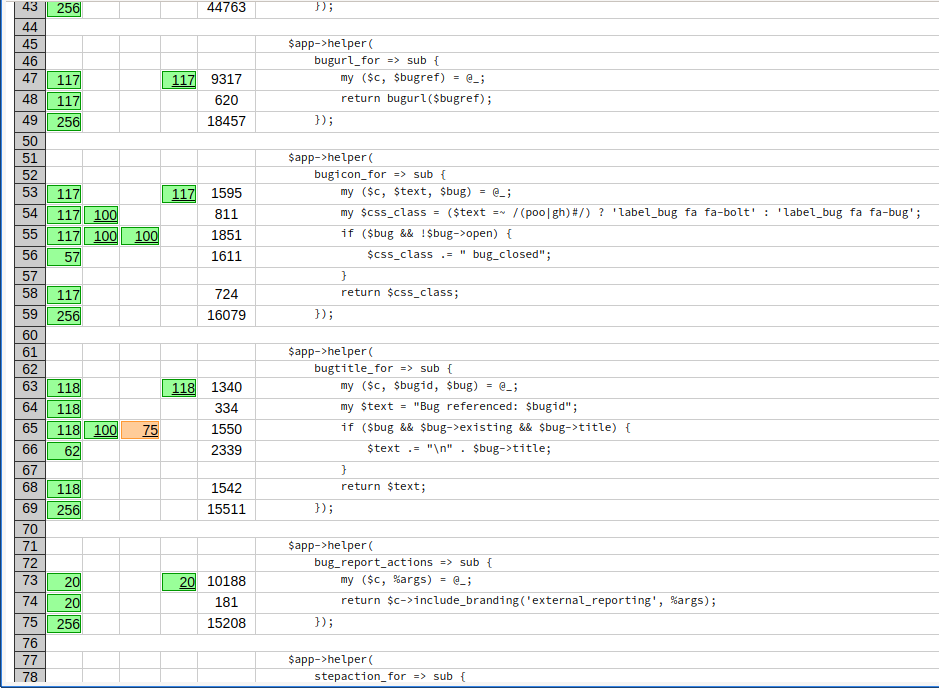
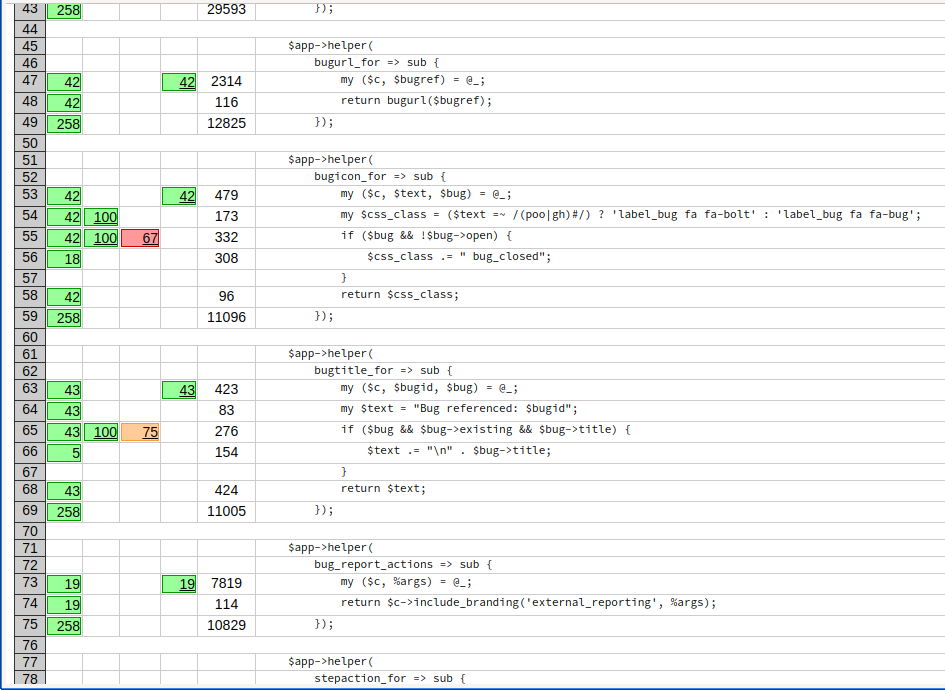
Regarding testing and coverage:
I ran a coverage test with the full Devel::Cover abilities to cover not only statements, but branches/conditions.
I attached two screenshots of the WebAPI::Plugin::Helpers module with the bug*_for methods. One shows the coverage before my PR and one after it.
The statement coverage for this module is 93.9 in both cases, but the branches/condition coverage has increased.
file	                            stmt	bran	cond	sub	time	total
lib/OpenQA/WebAPI/Plugin/Helpers.pm	93.9	82.3	72.7	90.2	0.0	89.1    # before
lib/OpenQA/WebAPI/Plugin/Helpers.pm	93.9	83.6	75.0	90.2	0.0	89.6    # after
So indeed my added test increased the coverage. We just don't measure it. One reason is that Codecov doesn't offer this.
The other is that it isn't really possible to mark single conditions as uncoverable.
Updated by okurz almost 4 years ago
tinita wrote:
[…]
The other is that it isn't really possible to mark single conditions as uncoverable.
What do you mean by that? https://metacpan.org/pod/Devel::Cover#Branches and https://metacpan.org/pod/Devel::Cover#Conditions explains how branches and conditions can be marked as uncoverable as well. Just that if we would really aim for 100% branch+condition coverage we would like go mad trying to mark all "uncoverable" conditions/branches as such.
Updated by ilausuch almost 4 years ago
- Status changed from Workable to In Progress
- Assignee set to ilausuch
Updated by openqa_review almost 4 years ago
- Due date set to 2021-08-04
Setting due date based on mean cycle time of SUSE QE Tools
Updated by ilausuch almost 4 years ago
- Description updated (diff)
In a conversation with Marius during the daily we establish a sort of roadmap and requirements:
- Check if telegraf can access to the logs or we need a script to do this job storing in the InfluxDB
- Check if we can filter the logs to cherry pick only the interesting logs to not overload the DB
Also we could add some more steps
- Store this information in influxDB as logs, or as parsed log information (check what is the better option)
- Create a view for these logs
- Create an alert for the cases that requires
Updated by okurz almost 4 years ago
ilausuch wrote:
- Check if we can filter the logs to cherry pick only the interesting logs to not overload the DB
but that's what openqa-logwarn is doing. Why not just call openqa-logwarn from telegraf and record the exit status, create a grafana dashboard for that with instructions how to check logs when the alert triggers
Updated by ilausuch almost 4 years ago
I think could be interesting to test this plugin (processor/parser)
https://github.com/influxdata/telegraf/blob/release-1.19/plugins/processors/parser/README.md
But also next article although old, is interesting because shows how to create a parser for a log file, and also use patterns. This could be really interesting because we could use this to analyze "[error] " pattern
https://www.influxdata.com/blog/telegraf-correlate-log-metrics-data-performance-bottlenecks/
Updated by ilausuch almost 4 years ago
okurz wrote:
ilausuch wrote:
- Check if we can filter the logs to cherry pick only the interesting logs to not overload the DB
but that's what openqa-logwarn is doing. Why not just call
openqa-logwarnfrom telegraf and record the exit status, create a grafana dashboard for that with instructions how to check logs when the alert triggers
Ok, an other interesting approach
Updated by ilausuch almost 4 years ago
Following https://github.com/influxdata/telegraf/blob/master/plugins/inputs/exec/README.md the way to have metrics about logs should be creating a configuration
[[inputs.exec]]
command = "/root/openqa-logwarn/logwarn_openqa"
data_format = "influx"
interval = "120s"
Using the example in the repo logwarn_openqa give us
[Mon Sep 26 21:16:43 2016] [19382:error] File iso/bar.iso is not a registered asset
[Mon Sep 26 21:16:46 2016] [19382:error] Directory repo/baz.license is not a registered asset
[Mon Sep 26 21:17:27 2016] [30003:error] MISSING S:scheduled R:none
[Wed Mar 29 11:25:38 2017] [14008:warn] FOOBAR=RAID0:ppc64le not found - check for typos and dependency cycles
[2018-02-06T04:02:24.0435 CET] [error] The world is coming to an end
Updated by ilausuch almost 4 years ago
I created a proposal PR. It is not tested yet
https://github.com/os-autoinst/salt-states-openqa/pull/1
https://gitlab.suse.de/openqa/salt-states-openqa/-/merge_requests/530
Updated by ilausuch almost 4 years ago
I tested the configuration creating a simple test with the lines that the MR introduces, and works in the moment we have logwarn installed and openqa_logwarn in the /opt directory
telegraf --test --debug --config telegraf-webui.conf
2021-08-03T12:55:38Z I! Starting Telegraf
2021-08-03T12:55:38Z D! [agent] Initializing plugins
2021-08-03T12:55:38Z D! [agent] Starting service inputs
2021-08-03T12:55:38Z D! [agent] Stopping service inputs
2021-08-03T12:55:38Z D! [agent] Input channel closed
2021-08-03T12:55:38Z D! [agent] Stopped Successfully
I tested also what happens if logwarn is not installed, openqa_logwarn is not in the /opt directory or /var/log/openqa is not present.
Updated by livdywan almost 4 years ago
ilausuch wrote:
I tested also what happens if logwarn is not installed, openqa_logwarn is not in the /opt directory or /var/log/openqa is not present.
!530 uses pkg.installed and git.cloned so I would assume salt fails if either one is missing.
In other words, why does it matter what happens if logwarn is not installed? Maybe you can clarify what you expect here?
Updated by okurz almost 4 years ago
https://gitlab.suse.de/openqa/salt-states-openqa/-/merge_requests/530 merged. I doubt we need to care more what happens if logwarn is not installed. The important part is about logwarn doing its job of warning about important new errors and not reporting about known stuff. Does this work?
Updated by mkittler almost 4 years ago
The SR has been merged but I don't find all questions I've asked in https://gitlab.suse.de/openqa/salt-states-openqa/-/merge_requests/530#note_335055 addressed in the comments here. It would have been nice to check whether the data gathered now can actually be used within Grafana. Accessing the data from Grafana could also help to answer the question raised in @okurz's last comment.
Updated by livdywan almost 4 years ago
Notes from our conversation:
- The config should use
commands = ["foobar"]like we also do here https://gitlab.suse.de/openqa/salt-states-openqa/-/blob/master/monitoring/telegraf/telegraf-common.conf#L34 -
https://github.com/os-autoinst/openqa-logwarn needs to be modified or forked to produce
logwarn,tag1=a,tag2=b i=42i,j=43i,k=44istyle output - https://github.com/martchus/openqa-helper#monitoring-with-telegrafinfluxdbgrafana has suggestions on how to test this
Updated by livdywan almost 4 years ago
- Due date deleted (
2021-08-04) - Status changed from In Progress to Workable
- Assignee deleted (
ilausuch)
I guess we can see if somebody else takes over from here. !537 has open questions.
Updated by mkittler almost 4 years ago
Note that this kind of alerting would also be useful to have for worker logs (see #96710#note-23).
Updated by okurz almost 4 years ago
- Subject changed from followup to: error on "Next & previous results": ajax error message and no results showing up size:M to Monitoring alerts on errors in logs (was: followup to: error on "Next & previous results": ajax error message and no results showing up) size:M
Updated by okurz almost 4 years ago
- Related to action #97544: Monitoring alerts on errors in logs on osd added
Updated by okurz almost 4 years ago
- Project changed from openQA Project (public) to openQA Infrastructure (public)
- Subject changed from Monitoring alerts on errors in logs (was: followup to: error on "Next & previous results": ajax error message and no results showing up) size:M to Monitoring alerts on errors in logs on o3 (was: followup to: error on "Next & previous results": ajax error message and no results showing up) size:M
- Description updated (diff)
- Category deleted (
Regressions/Crashes)
Updated by okurz over 3 years ago
- Related to action #80812: Fix mail sending on o3 size:S added
Updated by okurz over 3 years ago
- Status changed from Workable to Blocked
- Assignee set to okurz
first #80812
Updated by okurz over 3 years ago
- Status changed from Blocked to Feedback
After o3 email sending works again let's see how the team copes with alert handling :)
Updated by livdywan over 3 years ago
- Copied to action #105828: 4-7 logreport emails a day cause alert fatigue size:M added
Updated by okurz over 3 years ago
- Status changed from Feedback to Resolved
they did not give up yet, that's good enough :)