action #159654
closedcoordination #110833: [saga][epic] Scale up: openQA can handle a schedule of 100k jobs with 1k worker instances
coordination #108209: [epic] Reduce load on OSD
high response times on osd - nginx properly monitored in grafana size:S
0%
Description
Motivation
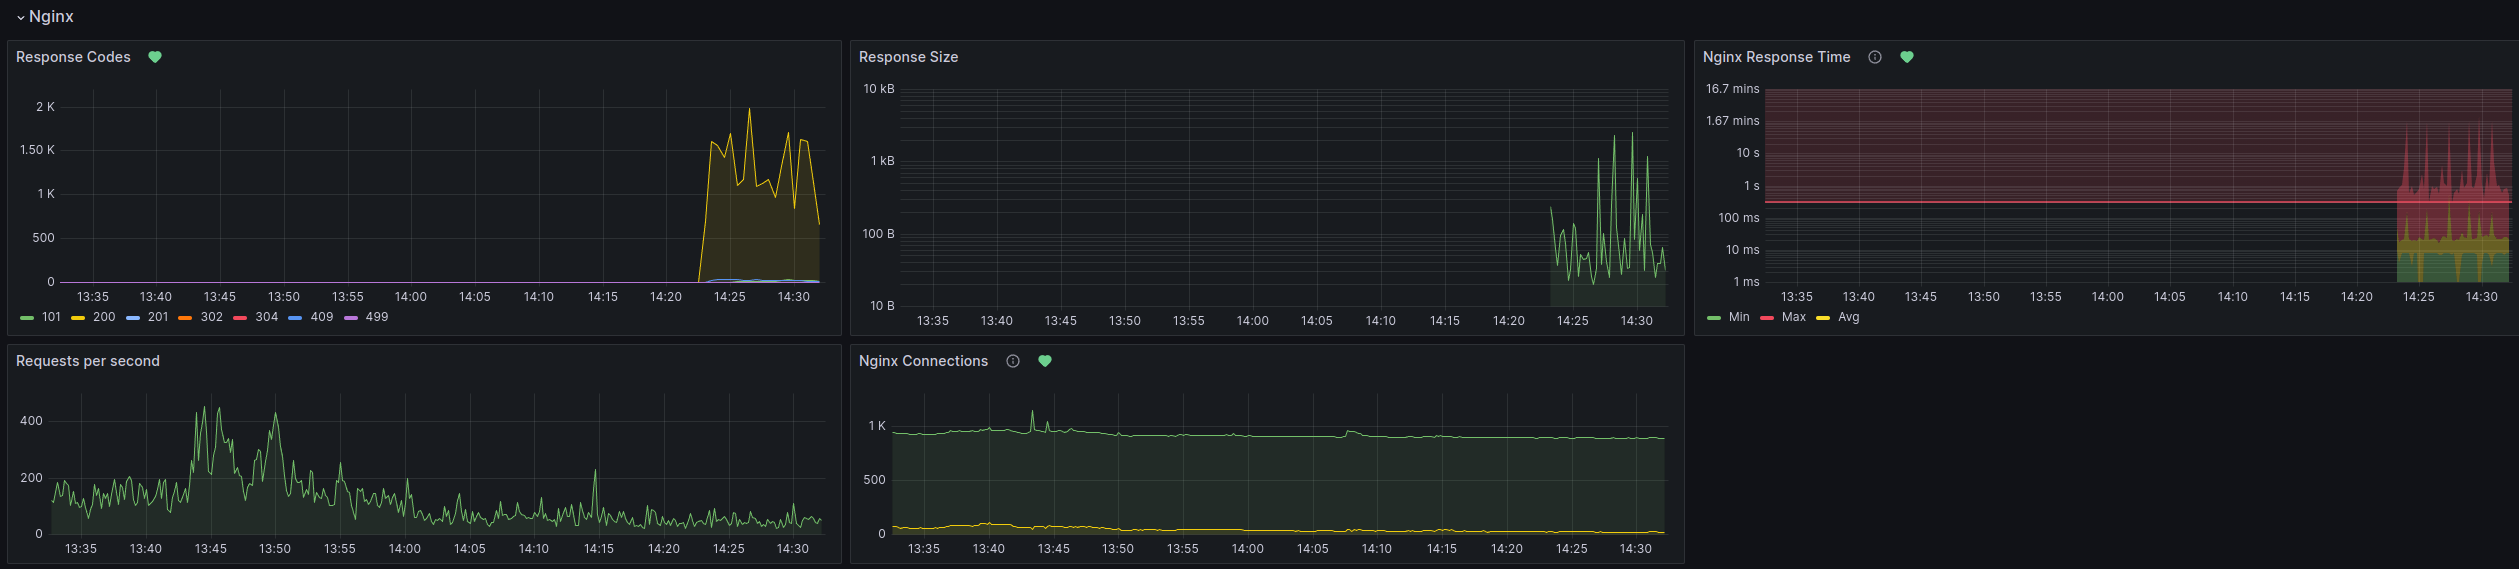
Apache in prefork mode uses a lot of resources to provide mediocre performance. We have nginx on OSD deployed with #159651. Now let's make sure we have it properly monitored as the web proxy is critical for the overall performance and user experience
Acceptance criteria
- AC1: Nginx on OSD is properly monitored in grafana
- AC2: No alerts about apache being down
Suggestions
- Follow #159651 for the actual nginx deployment
- Add changes to salt-states-openqa including monitoring: we have multiple panels regarding apache that need to be adapted for nginx as applicable
- Ensure that we have no alerts regarding "oh no, apache is down" ;)
Out of scope
- No need for any additional metrics, just feature-parity with what we have regarding apache, e.g. response sizes, response codes, response times
Files
Updated by okurz about 1 year ago
- Copied from action #159651: high response times on osd - nginx with enabled rate limiting features size:S added
Updated by jbaier_cz about 1 year ago
- Subject changed from high response times on osd - nginx properly monitored in grafana to high response times on osd - nginx properly monitored in grafana size:S
- Description updated (diff)
- Status changed from New to Workable
Updated by okurz about 1 year ago
- Target version changed from Tools - Next to Ready
Updated by jbaier_cz 12 months ago
First draft https://gitlab.suse.de/openqa/salt-states-openqa/-/merge_requests/1198; I would also like to include nginx monitoring setup with https://github.com/influxdata/telegraf/tree/master/plugins/inputs/nginx to replace the already removed [[inputs.apache]]
Updated by okurz 12 months ago
- Related to action #160877: [alert] Scripts CI pipeline failing due to osd yielding 502 size:M added
Updated by okurz 12 months ago
https://gitlab.suse.de/openqa/salt-states-openqa/-/merge_requests/1198 merged. https://monitor.qa.suse.de/d/WebuiDb/webui-summary?orgId=1 shows some panels with data but "response codes" and "respone times" panels show "No data" as of now. Might need some time to populate or actual fixing.
Updated by jbaier_cz 12 months ago
It could also mean that I made some mistake in the telegraf configuration and
[[inputs.tail]]
  files = ["/var/log/nginx/access.log"]
  interval = "30s"
  from_beginning = false
  name_override = "nginx_log"
  ## For parsing logstash-style "grok" patterns:
  data_format = "grok"
  grok_patterns = ["%{CUSTOM_LOG}"]
  grok_custom_pattern_files = []
  grok_custom_patterns = '''
      CUSTOM_LOG %{COMBINED_LOG_FORMAT} rt=%{NUMBER:response_time_s:float} urt=%"{NUMBER:upstream_response_time_s:float}"
  '''
is not working as expected
Updated by jbaier_cz 12 months ago
Found the typo in the grok pattern, fix https://gitlab.suse.de/openqa/salt-states-openqa/-/merge_requests/1204