action #151807
closed[alert] o3 zabbix: Problem: /var/lib/snapshot-changes: Disk space is critically low (used > 94%) size:M
0%
Description
Observation
https://progress.opensuse.org/issues/151807
Date: Thu, 30 Nov 2023 19:51:09 +0000
From: zabbix@suse.de
To: o3-admins@suse.de
Subject: Problem: /space: Disk space is critically low (used > 94%)

Problem started at 20:36:00 on 2023.11.30
Problem name: /space: Disk space is critically low (used > 94%)
Host: ariel.dmz-prg2.suse.org
Severity: Average
Operational data: Space used: 4.82 TB of 5 TB (96.4 %)
Original problem ID: 629867054
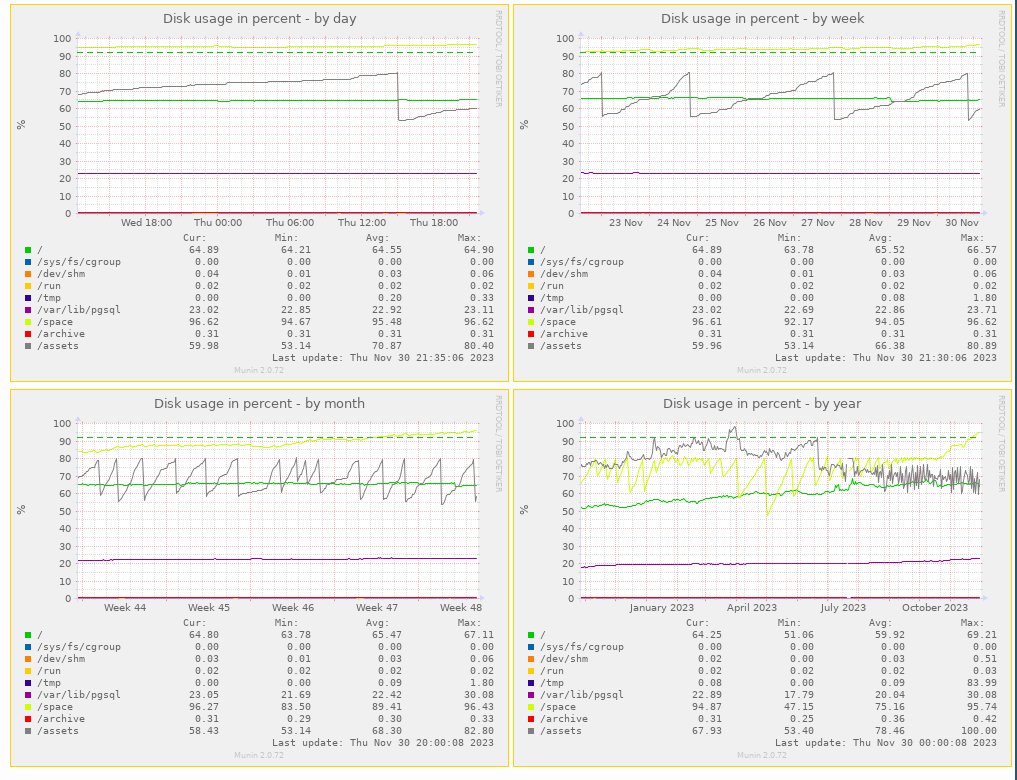
As you can see in the screenshot, it has been starting to increase around the last week of october.
Rollback
- Enable hook scripts:
- edit /opt/os-autoinst-scripts/openqa-label-known-issues-and-investigate-hook and remove the
exit - comment in hooks in /etc/openqa/openqa.ini
- edit /opt/os-autoinst-scripts/openqa-label-known-issues-and-investigate-hook and remove the
Suggestions
- Fix the problem and adjust the alert thresholds
Files
| o3-disk-space.png (98.9 KB) o3-disk-space.png | |||
| zabbix-disk-space-o3.png (64.7 KB) zabbix-disk-space-o3.png | |||
| zabbix-trigger-prototypes.png (228 KB) zabbix-trigger-prototypes.png |
Updated by tinita over 1 year ago · Edited
- Status changed from New to In Progress
- Assignee set to tinita
We found out that we have a large number of jobs without a group. Mostly investigate jobs.
We now added limits to jobs without a group (like we had already on osd), and currently it seems the limit_results_and_logs cleanup is able to slowly delete stuff.
[no_group_limits]
log_storage_duration = 10
important_log_storage_duration = 25
result_storage_duration = 15
important_result_storage_duration = 50
I also disabled the hook scripts to stop creating new investigate jobs for now.
We're monitoring the situation.
Updated by tinita over 1 year ago
- File zabbix-disk-space-o3.png zabbix-disk-space-o3.png added
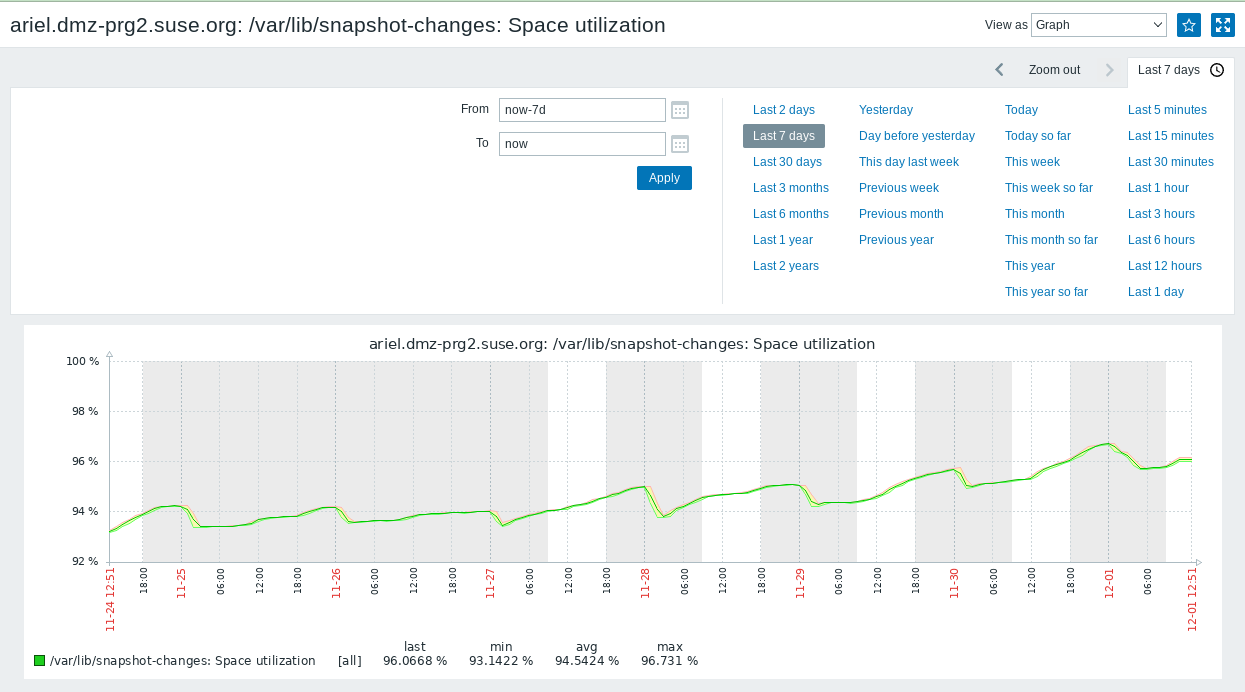
Additional question: Zabbix apparently thought already yesterday evenung that the problem had been resolved, although the graph clearly shows that the used space never went below 94% since the alarm: https://zabbix.suse.de/history.php?action=showgraph&itemids%5B%5D=342059
Hm, and having a closer look at that graph, It was already above 94% way before: https://zabbix.suse.de/history.php?action=showgraph&itemids%5B%5D=342059
See sreenshot.
Could it be that the alert has the 94 in the description, but the treshold is actually 96? That would explain the short timeframe, and that we actually got a new alert this morning when it went over 96 again?
I am again lost in zabbix configuration, I can't figure out the threshold.
Updated by jbaier_cz over 1 year ago
tinita wrote in #note-3:
Additional question: Zabbix apparently thought already yesterday evenung that the problem had been resolved, although the graph clearly shows that the used space never went below 94% since the alarm: https://zabbix.suse.de/history.php?action=showgraph&itemids%5B%5D=342059
Hm, and having a closer look at that graph, It was already above 94% way before: https://zabbix.suse.de/history.php?action=showgraph&itemids%5B%5D=342059
See sreenshot.
Could it be that the alert has the94in the description, but the treshold is actually 96? That would explain the short timeframe, and that we actually got a new alert this morning when it went over 96 again?
I am again lost in zabbix configuration, I can't figure out the threshold.
You can see the configuration of the trigger at https://zabbix.suse.de/triggers.php?form=update&triggerid=115396&context=host; the trigger is apparently a little more complicated that just a simple percentage:
Two conditions should match: First, space utilization should be above {$VFS.FS.PUSED.MAX.CRIT:"/var/lib/snapshot-changes"}.
Second condition should be one of the following:
- The disk free space is less than 5G.
- The disk will be full in less than 24 hours.
The second part of the condition timeleft(/ariel.dmz-prg2.suse.org/vfs.fs.size[/var/lib/snapshot-changes,pused],1h,100)<1d is what creates the recovery for the alarm if the space utilization growth is "not fast enough" to fill the partition in one day.
Updated by tinita over 1 year ago · Edited
I would vote for removing that "fill the partition in one day" condition. If we are only alerted when there's 1 day left, that means we could run full on a weekend.
Updated by jbaier_cz over 1 year ago
tinita wrote in #note-5:
I would vote for removing that "fill the partition in one day" condition. If we are only alerted when there's 1 day left, that means we could run full on a weekend.
Or we can tweak the interval, like have a prediction for a week maybe? But anyway, the trigger is from the trigger prototype (it is automatically added for all discovered partitions), the prototype is added from a generic template (which we cannot edit); so the process is:
- clone the prototype: https://zabbix.suse.de/trigger_prototypes.php?form=update&parent_discoveryid=341978&triggerid=115361&context=host
- edit the new clone as desired (the template expression for the triggers which will be created by the discovery)
- disable the old prototype (prevent the discovery) and disable the old triggers; new triggers from the clone will eventually appear
Updated by openqa_review over 1 year ago
- Due date set to 2023-12-16
Setting due date based on mean cycle time of SUSE QE Tools
Updated by mkittler over 1 year ago · Edited
- Status changed from In Progress to Resolved
Now after https://openqa.opensuse.org/minion/jobs?id=3198982 ran for 13 hours and several limit_screenshot jobs ran also for multiple hours (https://openqa.opensuse.org/minion/jobs?task=limit_screenshots) we're back at 50 % which is quite good.
/var/lib/snapshot-changes: Disk space is critically low (used > 94%) now also shows up as resolved in Zabbix.
We have also discussed this in the infra daily. So this ticket can be considered resolved.
Updated by tinita over 1 year ago
- Status changed from Resolved to Feedback
The rollback steps weren't conducted, which is why we did not have any investigate jobs or any other thing done by hook scripts.
I now enabled the hook scripts in openqa.ini, removed the temporary exit in openqa-label-known-issues-and-investigate-hook and restarted gru.
Also there was this open discussion about not being notified early enough, so I would rather like this being kept open and discuss it.
Updated by tinita over 1 year ago
Also I set back max_running_jobs to 170. We lowered it to make sure the load is not too high so the cleanup job can finally finish.
Updated by tinita over 1 year ago
Ok, i tried to clone the alert but Zabbix is having problems right now, will try again later.
Updated by tinita over 1 year ago
- Subject changed from [alert] o3 zabbix: Problem: /var/lib/snapshot-changes: Disk space is critically low (used > 94%) to [alert] o3 zabbix: Problem: /var/lib/snapshot-changes: Disk space is critically low (used > 94%) size:M
- Description updated (diff)
Updated by tinita over 1 year ago
- Status changed from Feedback to In Progress
Still trying to figure out the Zabbix configuration. Apparently there is also a "Warning" trigger, but the only difference is that it would warn if there are only 10GB left, and the "Average" trigger (which is apparently higher than Warning) will warn if there are only 5GB left.
On a disk with several TB these hardcoded GB values of course don't make much sense.
Apart from that the condition about when the disk will be full is equal for both.
I increased the values for WARN and CRIT to 85% / 90% now and will edit the timeleft conditions.
Updated by tinita over 1 year ago
jbaier_cz wrote in #note-6:
- clone the prototype: https://zabbix.suse.de/trigger_prototypes.php?form=update&parent_discoveryid=341978&triggerid=115361&context=host
- edit the new clone as desired (the template expression for the triggers which will be created by the discovery)
- disable the old prototype (prevent the discovery) and disable the old triggers; new triggers from the clone will eventually appear
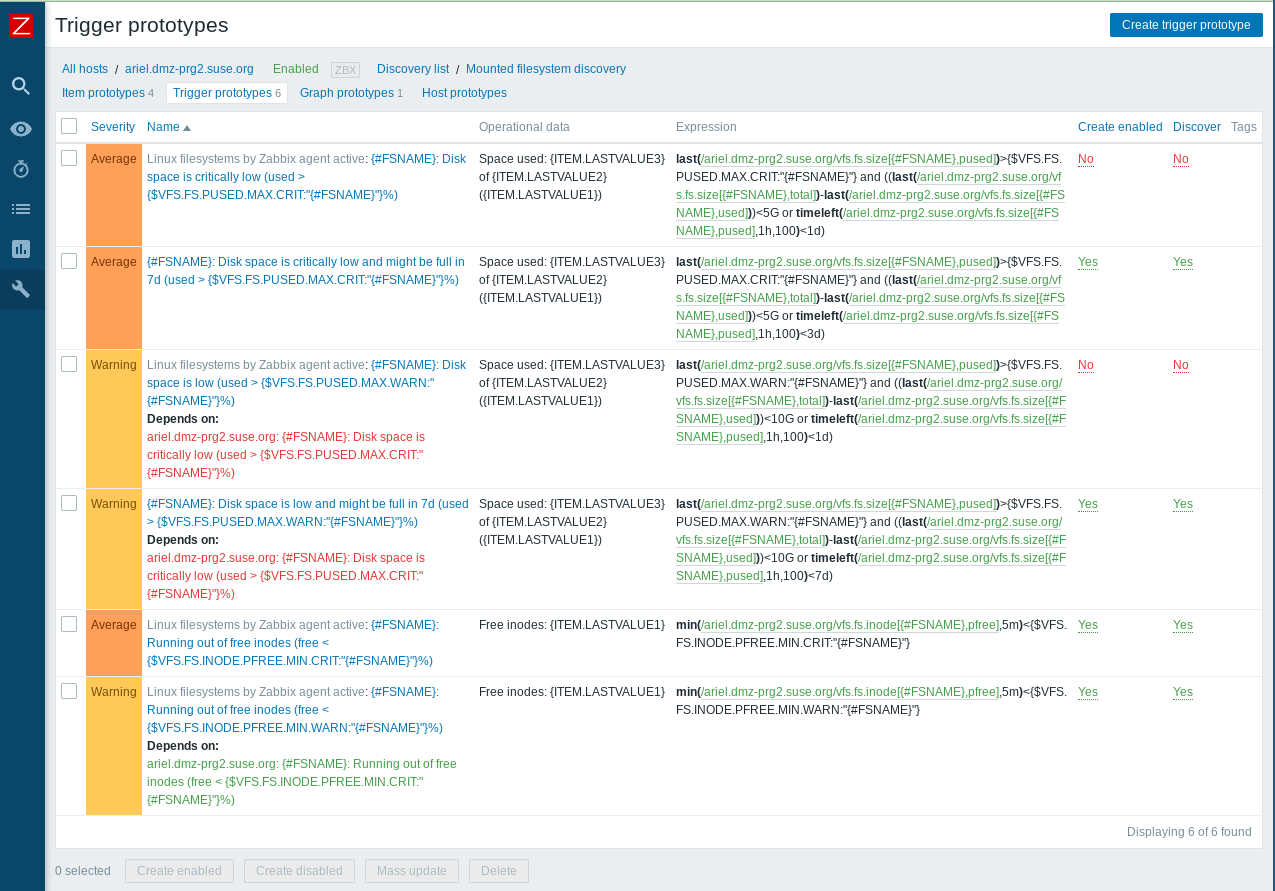
I'm not sure if I did the right thing. There is no checkbox for disabling or enabling, just "Create enabled".
I don't know what "Discover" means, but I unchecked it for the old triggers.
Now I guess I have to wait until the new triggers will "eventually appear", but I don't know where they will appear and how long it could take. I mean, they already appear in the prototype list, because I created them.
I attached a screenshot of how it currently looks like.
Updated by jbaier_cz over 1 year ago
tinita wrote in #note-14:
jbaier_cz wrote in #note-6:
- clone the prototype: https://zabbix.suse.de/trigger_prototypes.php?form=update&parent_discoveryid=341978&triggerid=115361&context=host
- edit the new clone as desired (the template expression for the triggers which will be created by the discovery)
- disable the old prototype (prevent the discovery) and disable the old triggers; new triggers from the clone will eventually appear
I'm not sure if I did the right thing. There is no checkbox for disabling or enabling, just "Create enabled".
I don't know what "Discover" means, but I unchecked it for the old triggers.
Yes, disabling discovery is the right choice (discovery is the process of automatic item creation).
Now I guess I have to wait until the new triggers will "eventually appear", but I don't know where they will appear and how long it could take. I mean, they already appear in the prototype list, because I created them.
The main discovery rule (https://zabbix.suse.de/host_discovery.php?form=update&itemid=341978&context=host) has 1h update interval, so the new items/triggers on the host should appear within an hour. The old will disappear within 30 days.
Updated by tinita over 1 year ago
Maybe we can look at it together thursday? I don't know where to look for its appearance...
Updated by jbaier_cz over 1 year ago
tinita wrote in #note-17:
Maybe we can look at it together thursday? I don't know where to look for its appearance...
Yes, we can if you want. For what I can see, your new triggers are there: https://zabbix.suse.de/triggers.php?filter_set=1&filter_hostids%5B0%5D=10923&context=host
Updated by tinita over 1 year ago
- Status changed from Feedback to Resolved
Ok, we checked it together and the new triggers are here: https://zabbix.suse.de/triggers.php?filter_set=1&filter_hostids%5B0%5D=10923&context=host
and the old triggers are not listed there anymore.
Updated by okurz 12 months ago
- Related to action #162521: Reconsider the global job limit on o3, try higher than 170 added