action #127025
closed[tools][metrics] Improve cycle + lead times in Grafana
0%
Description
Motivation
In #121582 we added statistics from our backlog to Grafana:
- Ticket counts of the different backlog queries
- Cycle & lead times
The cycle and lead times are reported in a way that we can calculate the mean times, but not median.
It was requested that we support median.
Also it should be possible to feed data for a certain time frame to Grafana, e.g. when we change something in the calculation, or the Grafana database is gone, or we simply want to import historical data. Ideally this script can be used by other teams as well.
Acceptance criteria
- AC1: Grafana graphs for cycle and lead time based on the median instead of mean are available
Suggestions
- Find out why in https://github.com/openSUSE/backlogger/blob/main/backlogger.py#L198 it was chosen to calculate the mean value instead of just feeding all raw values directly to grafana?
- It wasn't chosen to feed the mean value. Like tinita wrote in https://progress.opensuse.org/issues/121582#note-34 it would be wrong to feed the mean value to Grafana. Instead we feed the sum of cycle times and the number of tickets.
- Extract the leadTime calculation from the backlogger script, because the original backlog status page script doesn't need this, and it will make it easier to add new options that don't make much sense for the backlogger
- Refactor/split up the code to avoid copying logic/config data if that makes sense (unless it's more work and not worth the effort)
- Use the same codebase since other teams can also benefit from this effort
- Metrics can be computed based on an option for a certain timeframe
- Metrics still include data for the last day by default
- Metrics include data for each individual ticket, so we can calculate the median in Grafana
- Read up what median is and how to compute it :-D
- MAke this an additional feature that can be used at the same time (so we can compare both accurately based on real data)
Files
Updated by tinita about 2 years ago
- Copied from action #121582: [tools][metrics] Calculate cycle + lead times for SUSE QE Tools continuously size:M added
Updated by livdywan over 1 year ago
- Description updated (diff)
- Status changed from New to Workable
Updated by okurz over 1 year ago
- Status changed from Workable to In Progress
- Assignee set to okurz
tinita and me discussed this in detail and we found that we should be able to work with the values that are written from backlogger.py but that we can just change how values are evaluated and displayed in grafana
Updated by okurz over 1 year ago
Updated by okurz over 1 year ago
or if we want to go more fancy
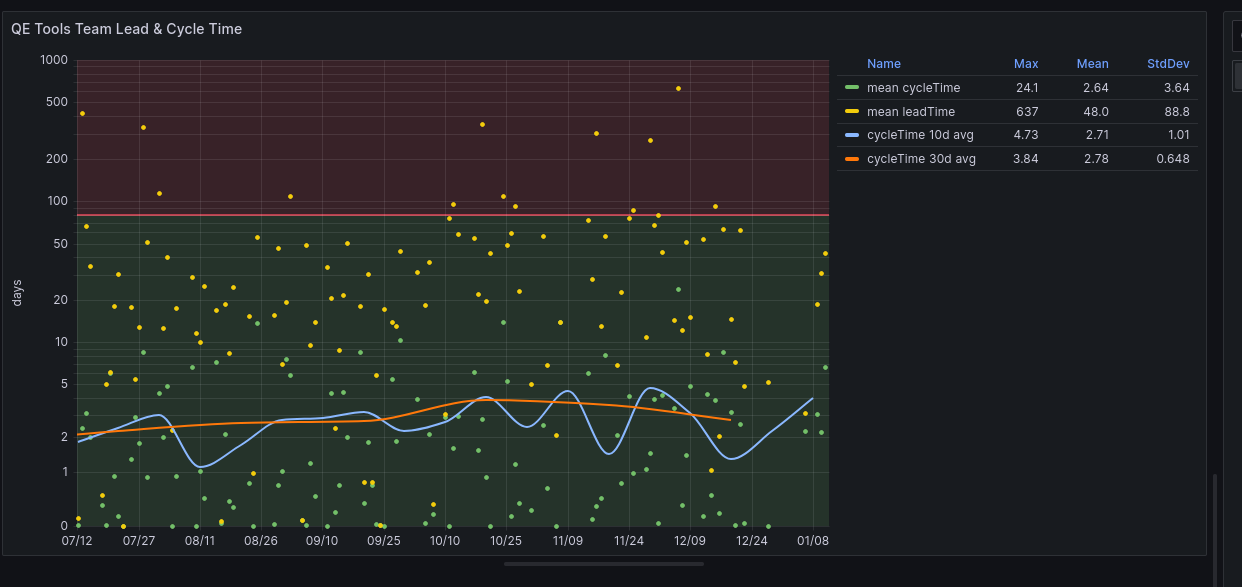
with logarithmic scale and trend lines
Updated by openqa_review over 1 year ago
- Due date set to 2024-01-26
Setting due date based on mean cycle time of SUSE QE Tools
Updated by okurz over 1 year ago
- Status changed from In Progress to Feedback
https://gitlab.suse.de/openqa/salt-states-openqa/-/merge_requests/1080 merged. Waiting for feedback from team regarding latest proposal.
Updated by okurz over 1 year ago
Updated by okurz over 1 year ago
- Due date deleted (
2024-01-26) - Status changed from Feedback to Resolved
merged. While with the current technical approach only an averaged mean value is shown I still think those values produce something that helps us. We always assumed a cycle time of 14 (calendar) days. The cycle time that we compute has an average value of around 5-6 calendar days. That is because in our calculation in backlogger.py we only really count the time when a ticket is "In Progress" so any waiting time in between when setting to any other state, e.g. "Workable" or "Feedback" don't count towards that. But actually I think we can also work with that knowing our way to calculate.
Updated by okurz over 1 year ago
- Related to action #152957: Weekly evaluation of cycle-times within SUSE QE Tools size:S added