action #133889
closed[alert] Minion jobs failed hook alert
0%
Description
Observation
Firing [stats.openqa-monitor.qa.suse.de]
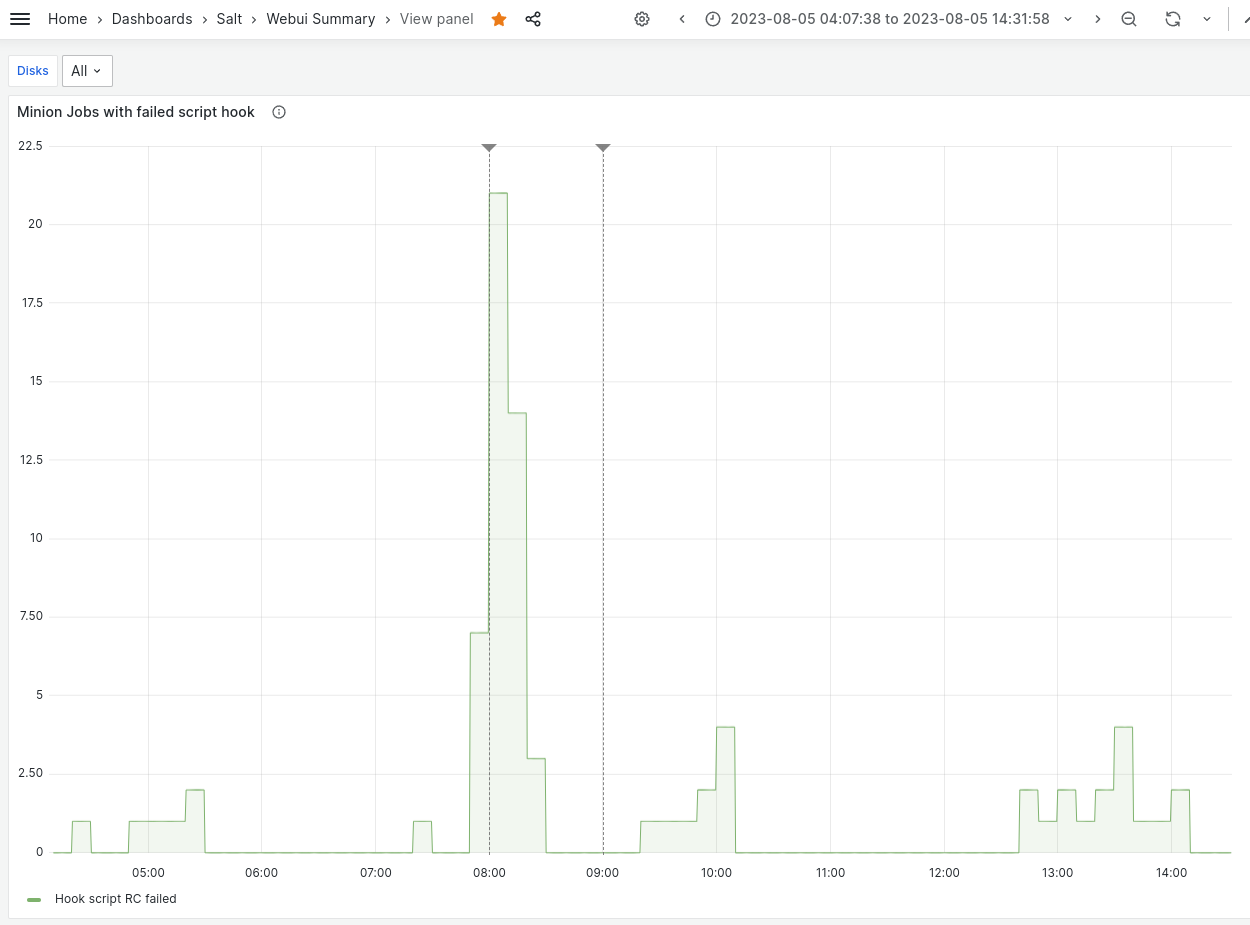
web UI: Minion jobs failed hook alert
View alert [stats.openqa-monitor.qa.suse.de]
Values
A0=21
Labels
alertname
web UI: Minion jobs failed hook alert
grafana_folder
Salt
rule_uid
minion_jobs_failed_hook_alert
Annotations
message
Too many minion jobs with failed hook scripts.
https://stats.openqa-monitor.qa.suse.de/alerting/grafana/e06a9f3f-205f-4733-b63b-4a84dfea1535/view?orgId=1
https://stats.openqa-monitor.qa.suse.de/d/WebuiDb/webui-summary?viewPanel=201&orgId=1&from=1691201258115&to=1691238718573
According to the grafana panel there were 21 failures between 08:00 and 08:10, however I don't see matching entries in the gru journal around that time. journalctl -u openqa-gru --since "2023-08-05 00:00:00"
There are much more failures around 06:00.
Also looking at other occasions of failures (under the alarm threshold) the time in grafana doesn't fit the journal.
The journal timestamps are in CEST. Am I missing something?
Files
Updated by tinita over 1 year ago
Updated by tinita over 1 year ago
Looking into the database there are exactly 21 failures between 5:50 and 6:00 so something is off with the timezone:
select id, task, notes->'hook_rc' as hook_rc, substring(cast(notes->'hook_result' as varchar),0, 30) as hook_result, created, finished from minion_jobs where cast(notes->'hook_rc' as int) != 0 and finished >= timezone('UTC', now()) - interval '3 days' order by finished;

 7977739 | hook_script | 255     | ""                            | 2023-08-05 05:50:26.523238+02 | 2023-08-05 05:51:30.606196+02
 7977740 | hook_script | 255     | ""                            | 2023-08-05 05:50:26.742767+02 | 2023-08-05 05:51:30.611761+02
 7977753 | hook_script | 255     | ""                            | 2023-08-05 05:51:32.909335+02 | 2023-08-05 05:52:25.162042+02
 7977755 | hook_script | 255     | ""                            | 2023-08-05 05:51:40.029269+02 | 2023-08-05 05:52:36.394589+02
 7977758 | hook_script | 255     | ""                            | 2023-08-05 05:51:54.022054+02 | 2023-08-05 05:52:41.54201+02
 7977760 | hook_script | 255     | ""                            | 2023-08-05 05:51:59.555471+02 | 2023-08-05 05:52:42.892683+02
 7977770 | hook_script | 255     | ""                            | 2023-08-05 05:53:14.398472+02 | 2023-08-05 05:54:03.31148+02
 7977773 | hook_script | 255     | ""                            | 2023-08-05 05:53:20.68269+02  | 2023-08-05 05:54:25.735996+02
 7977779 | hook_script | 255     | ""                            | 2023-08-05 05:54:26.933056+02 | 2023-08-05 05:55:07.334518+02
 7977783 | hook_script | 255     | ""                            | 2023-08-05 05:54:37.674805+02 | 2023-08-05 05:55:12.504923+02
 7977784 | hook_script | 255     | ""                            | 2023-08-05 05:54:38.669223+02 | 2023-08-05 05:55:22.869153+02
 7977789 | hook_script | 255     | ""                            | 2023-08-05 05:55:36.672299+02 | 2023-08-05 05:56:22.031428+02
 7977791 | hook_script | 255     | ""                            | 2023-08-05 05:55:56.969966+02 | 2023-08-05 05:56:50.594888+02
 7977792 | hook_script | 255     | ""                            | 2023-08-05 05:55:58.203037+02 | 2023-08-05 05:56:50.596544+02
 7977801 | hook_script | 255     | ""                            | 2023-08-05 05:56:56.517633+02 | 2023-08-05 05:57:43.582548+02
 7977808 | hook_script | 255     | ""                            | 2023-08-05 05:57:34.495698+02 | 2023-08-05 05:58:22.310047+02
 7977809 | hook_script | 255     | ""                            | 2023-08-05 05:57:34.520299+02 | 2023-08-05 05:58:22.315906+02
 7977820 | hook_script | 255     | ""                            | 2023-08-05 05:58:47.29075+02  | 2023-08-05 05:59:23.967299+02
 7977821 | hook_script | 255     | ""                            | 2023-08-05 05:58:47.34349+02  | 2023-08-05 05:59:23.968782+02
 7977823 | hook_script | 255     | ""                            | 2023-08-05 05:58:52.028527+02 | 2023-08-05 05:59:29.086011+02
 7977830 | hook_script | 255     | ""                            | 2023-08-05 05:59:40.35422+02  | 2023-08-05 06:00:25.922788+02
Updated by tinita over 1 year ago
Looking into the influxdb directly:
> select * from openqa_minion_jobs_hook_rc_failed where rc_failed_per_10min=21;
name: openqa_minion_jobs_hook_rc_failed
time                host   rc_failed_per_10min url
----                ----   ------------------- ---
1691215200000000000 openqa 21                  https://openqa.suse.de
and that timestamp is Sat Aug 5 06:00:00 2023 UTC
The last entry in that table is 1691415600000000000 which is Mon Aug 7 13:40:00 2023, so that's now in UTC, that looks fine.
According to the minion database, the 21 failures happened between 5:50 and 6:00 +0200, so in the influx database I would expect 04:00 UTC.
I don't get it...
Updated by tinita over 1 year ago
Found it out. When selecting the failed minion jobs from the minion database, we pass a Datetime object to raw sql, so it will get stringified, and the fact that it is in timezone UTC gets lost, so postresql (by default on CET it seems) assumes the wrong timezone. We can just append a +0000 to the timestamp in SQL.
Updated by tinita over 1 year ago
- Status changed from New to In Progress
- Assignee set to tinita
Updated by tinita over 1 year ago
https://github.com/os-autoinst/openQA/pull/5274 Add timezone to SQL query
Updated by okurz over 1 year ago
- Tags set to alert, reactive work
- Priority changed from Normal to High
- Target version set to Ready
Updated by tinita over 1 year ago
- Status changed from In Progress to Resolved
Now looking at the actual cause.
These failures were all instances of Current job 12345 will fail, because the repositories for the below updates are unavailable, which is currently resulting in a failure, but it's actually not really a failure. Ticket for that: #130778
So resolving.
Updated by tinita over 1 year ago
- Status changed from Resolved to Feedback
Another fix for the SQL, I was blind when doing the first fix: https://github.com/os-autoinst/openQA/pull/5282
Updated by tinita over 1 year ago
- Status changed from Feedback to Resolved
PR merged, deployed on osd, now the grafana panel matches what's in the minion database.